Z-scales peptide descriptors were developed because a peptide residue is not just “hydrophobic” or “hydrophilic.” It also has size, shape, charge distribution, polarizability, and solvent-dependent behavior. A one-number descriptor can be useful for a first look, but it is often too incomplete on its own to explain coupling difficulty, crude solubility, RP-HPLC behavior, or structure-activity trends. In that sense, Z-scales are best understood as multivariate residue descriptors used for sequence-property modeling, not as direct observables or exact composition-derived properties.
That distinction matters. A physical constant such as molecular weight has one exact answer for a given composition. A Z-scale coordinate does not. It is a compressed statistical representation of residue behavior derived from a larger physicochemical property matrix containing experimental and calculated variables. It helps the chemist organize sequence space and compare analogues rationally, but it does not replace bench data, LC-MS, or scouting purification.
Predict Sequence Behavior with Peptalyzer™
Use Peptalyzer™ to map local hydropathy, steric load, and aggregation-prone regions before starting your synthesis.
📘 What will you learn here?
The “GRAVY” Illusion: Why Kyte-Doolittle and Hopp-Woods Can Mislead Synthesis Decisions When Used Alone
The practical problem with univariate indices is not that they are wrong. It is that they are incomplete.
GRAVY Compresses Too Much Sequence Information
GRAVY, based on the Kyte-Doolittle hydropathy scale, reduces a peptide to a single average hydropathy value. That is useful for a broad first impression. But an average hides sequence patterning. Two peptides can share nearly the same GRAVY score and still behave very differently during Fmoc-SPPS or purification because GRAVY does not retain positional information. One may contain a dense aromatic-hydrophobic patch that contributes to resin-bound aggregation or difficult handling. The other may distribute similar hydropathy more evenly and therefore present a lower local aggregation burden.
Hopp-Woods Adds Local Hydrophilicity, But Still Stays One-Dimensional
Hopp-Woods has a different strength and a different limitation. It is better suited to identifying locally hydrophilic regions and candidate surface-exposed or antigenic segments. But it is still a one-axis view. It does not explicitly encode steric crowding, side-chain bulk, or subtle electronic effects that influence local recognition and packing.
This is the chemist’s trap: treating a single hydropathy or hydrophilicity descriptor as if it were a full description of sequence behavior. At the bench, that trap appears in familiar ways. A peptide with a “reasonable” GRAVY score may still synthesize poorly after a bulky segment because the limiting factor can be local steric congestion rather than global hydropathy. Another peptide may show acceptable average hydropathy yet still show unexpectedly strong RP-HPLC retention or difficult recovery because a short lipophilic patch can dominate local interactions with the stationary phase. A third may look balanced by Hopp-Woods yet still behave unexpectedly because hydrophilicity alone does not capture steric and electronic contributions.
Why Peptalyzer™ Separates These Views
So Kyte-Doolittle and Hopp-Woods remain useful. They are not obsolete. But they should be treated as first-pass screening descriptors, not as standalone decision tools for synthesis planning.
This logic also fits the current Peptalyzer™ architecture. The platform already separates GRAVY, Hopp-Woods, Wimley-White, aggregation risk, and SPPS difficulty into different views rather than treating one scalar as sufficient to describe peptide behavior.
Information Density: From One Number to a 5D Residue Coordinate
Z-scales address this limitation by replacing a single descriptor with a compact multivariate coordinate system. Instead of assigning one value per residue, the method assigns a vector:
\[\mathbf{z}_i = \left(z_{1,i}, z_{2,i}, z_{3,i}, z_{4,i}, z_{5,i}\right)\]where residue i is described by five orthogonal principal-component dimensions.
- z1 captures the dominant hydrophilicity / hydrophobicity trend,
- z2 captures a steric / bulk and polarizability-related pattern within the Sandberg PCA space. It should not be read as simple residue volume, because the sign and magnitude depend on the full multivariate descriptor matrix,
- z3 captures electronic polarity / charge-related variation, while z4, and z5 capture finer electronic effects.
The key advantage is information density. A single number tells you only where a residue lies on one axis. A five-dimensional vector tells you where it lies in a property space. That means the chemist can distinguish residues that appear similar by hydropathy alone but differ in steric or electronic properties.
From Residue Vectors to an N × 5 Sequence Representation
For a peptide of length N, the sequence becomes an N × 5 matrix rather than a 1D list of scalar scores:
\[\mathbf{Z} =
\begin{bmatrix}
z_{1,1} & z_{2,1} & z_{3,1} & z_{4,1} & z_{5,1} \\
z_{1,2} & z_{2,2} & z_{3,2} & z_{4,2} & z_{5,2} \\
\vdots & \vdots & \vdots & \vdots & \vdots \\
z_{1,N} & z_{2,N} & z_{3,N} & z_{4,N} & z_{5,N}
\end{bmatrix}
\]
That is a practical gain for sequence encoding and comparison. Once the sequence is encoded in this form, the chemist can inspect local windows, average profiles, residue hotspots, or analogue series without collapsing all behavior into one average. A peptide no longer looks like “hydrophobic” or “polar.” It looks like a property landscape. This is why Z-scales are often more useful for design than single-axis plots. They do not reduce the sequence to one question. They preserve several compatible property dimensions at once.
The Goldilocks Zone: Why Z-Scales Often Occupy a Useful Middle Ground
A descriptor system can also become less useful when it becomes too large. In QSAR and QSAM work, adding variables is tempting because it appears to add chemical realism. Many peptide datasets are relatively small, noisy, or chemically narrow. A descriptor matrix that is too wide can become more prone to overfitting, especially when the number of variables begins to compete with the number of observations.
This is where Z-scales occupy a useful middle ground.
A one-dimensional scale such as GRAVY is often too limited to capture multicausal behavior. But high-dimensional descriptor systems can become hard to interpret and easy to overfit. Z-scales sit in the middle: compact enough to support relatively parsimonious modeling, but rich enough to encode polarity, steric effects, and electronics.
That “Goldilocks” position is one reason Z-scales have remained attractive in peptide and protein QSAR and proteochemometric modeling. They are not guaranteed to be the best descriptor family for every target or every dataset. That claim would be too strong. But they are often a rational starting point because they keep the parameter count relatively low without collapsing chemistry into a single axis.
From a bench perspective, this matters because the model can remain interpretable. If an analogue series fails after a hydrophobic substitution, the chemist wants to know whether the failure came from lipophilicity, steric load, or a finer electronic perturbation. A 5D system can still help you separate that question. A much larger descriptor family can make the answer less direct and harder to interpret.
Multivariate Origin: How PCA Compresses 26 Residue Properties into a Usable Framework
From 26 Residue Properties to PCA Coordinates
The strength of Z-scales comes from their origin. They are not arbitrary coding labels. They are principal components derived from a larger residue-property matrix that combines experimental and calculated descriptors. In the Sandberg expansion, that parent matrix includes chromatographic retention data, NMR descriptors, surface-area terms, van der Waals volume, and molecular-orbital-related variables. Formally, each residue begins as a 26-variable vector:
\[\mathbf{x}_i = \left(x_{i1}, x_{i2}, \ldots, x_{i26}\right)\]Principal component analysis then projects that vector into a lower-dimensional space:
\[\mathbf{z}_i = \mathbf{W}^{T}\mathbf{x}_i\]where W is the PCA (Principal Component Analysis) loading matrix.
The important point is chemical, not just mathematical. PCA compresses correlated information into orthogonal axes. Instead of carrying many partially redundant descriptors, the method extracts dominant latent trends. Those trends are easier to compare across residues and easier to use in regression or sequence analysis.
Why the Multivariate Origin Matters for Peptide Chemistry
This is why Z-scales can feel more chemically grounded than many purely theoretical encodings. Their source matrix includes solvent-sensitive and experimentally anchored behavior. They are not built only from abstract structural encoding. They are built from residue behavior as represented through chromatography, spectroscopy, and molecular property calculations.
For peptide chemistry, that is a useful starting point. Peptides do not behave in a vacuum. They behave in DMF, NMP, aqueous-organic HPLC eluents, cleavage cocktails, and crowded local sequence environments. So the multivariate origin of Z-scales is not just a technical detail. It is one reason they remain relevant.
- PCA-based dimensionality reduction of a multiproperty matrix into orthogonal components is a validated statistical framework.
- Using the first components to describe peptide-relevant trends such as hydrophobicity, steric effects, polarity, and retention-related behavior is widely accepted in descriptor-based modeling.
- The most refined interpretation of z4 and z5 as direct proxies for receptor-specific recognition remains target-dependent and should not be generalized too aggressively.
Why This Matters Before You Reach the Reactor or the HPLC
The real value of Z-scales is not conceptual elegance. It is earlier risk recognition.
Before synthesis starts, they let you ask whether a substitution changes only hydropathy or also adds local steric pressure. Before purification starts, they let you ask whether difficult recovery may reflect broad lipophilicity or a short dominant hydrophobic patch. And before building a QSAR model, they let you describe a sequence with enough physicochemical detail to remain meaningful, but not so many variables that the model becomes unnecessarily complex.
That is why univariate indices are often useful as a first glance, but limited as a final lens.
Definition and Mechanism: What z1 to z5 Represents
Z-scales should not be read as direct measurements like molecular weight or pI. They are latent descriptor axes produced by principal component analysis. In the original Hellberg framework, three principal properties were extracted from a matrix of 29 physicochemical variables for the 20 coded amino acids. Sandberg later expanded that logic to a five-component system using 26 descriptor variables across 87 amino acids, making the framework compact while extending it to a broader amino-acid space.
\[z_{k,i} = \sum_{m=1}^{M} w_{k,m}\,x_{m,i}\]Mathematically, each component is a weighted combination of underlying variables rather than a standalone observable:
where zk,i is the k-th Z-component for residue i, xm,i is the m-th underlying property, and wk,m is the PCA loading for that property. This is why each Z-component has a dominant interpretation, but should not be treated as a perfectly pure physical axis.
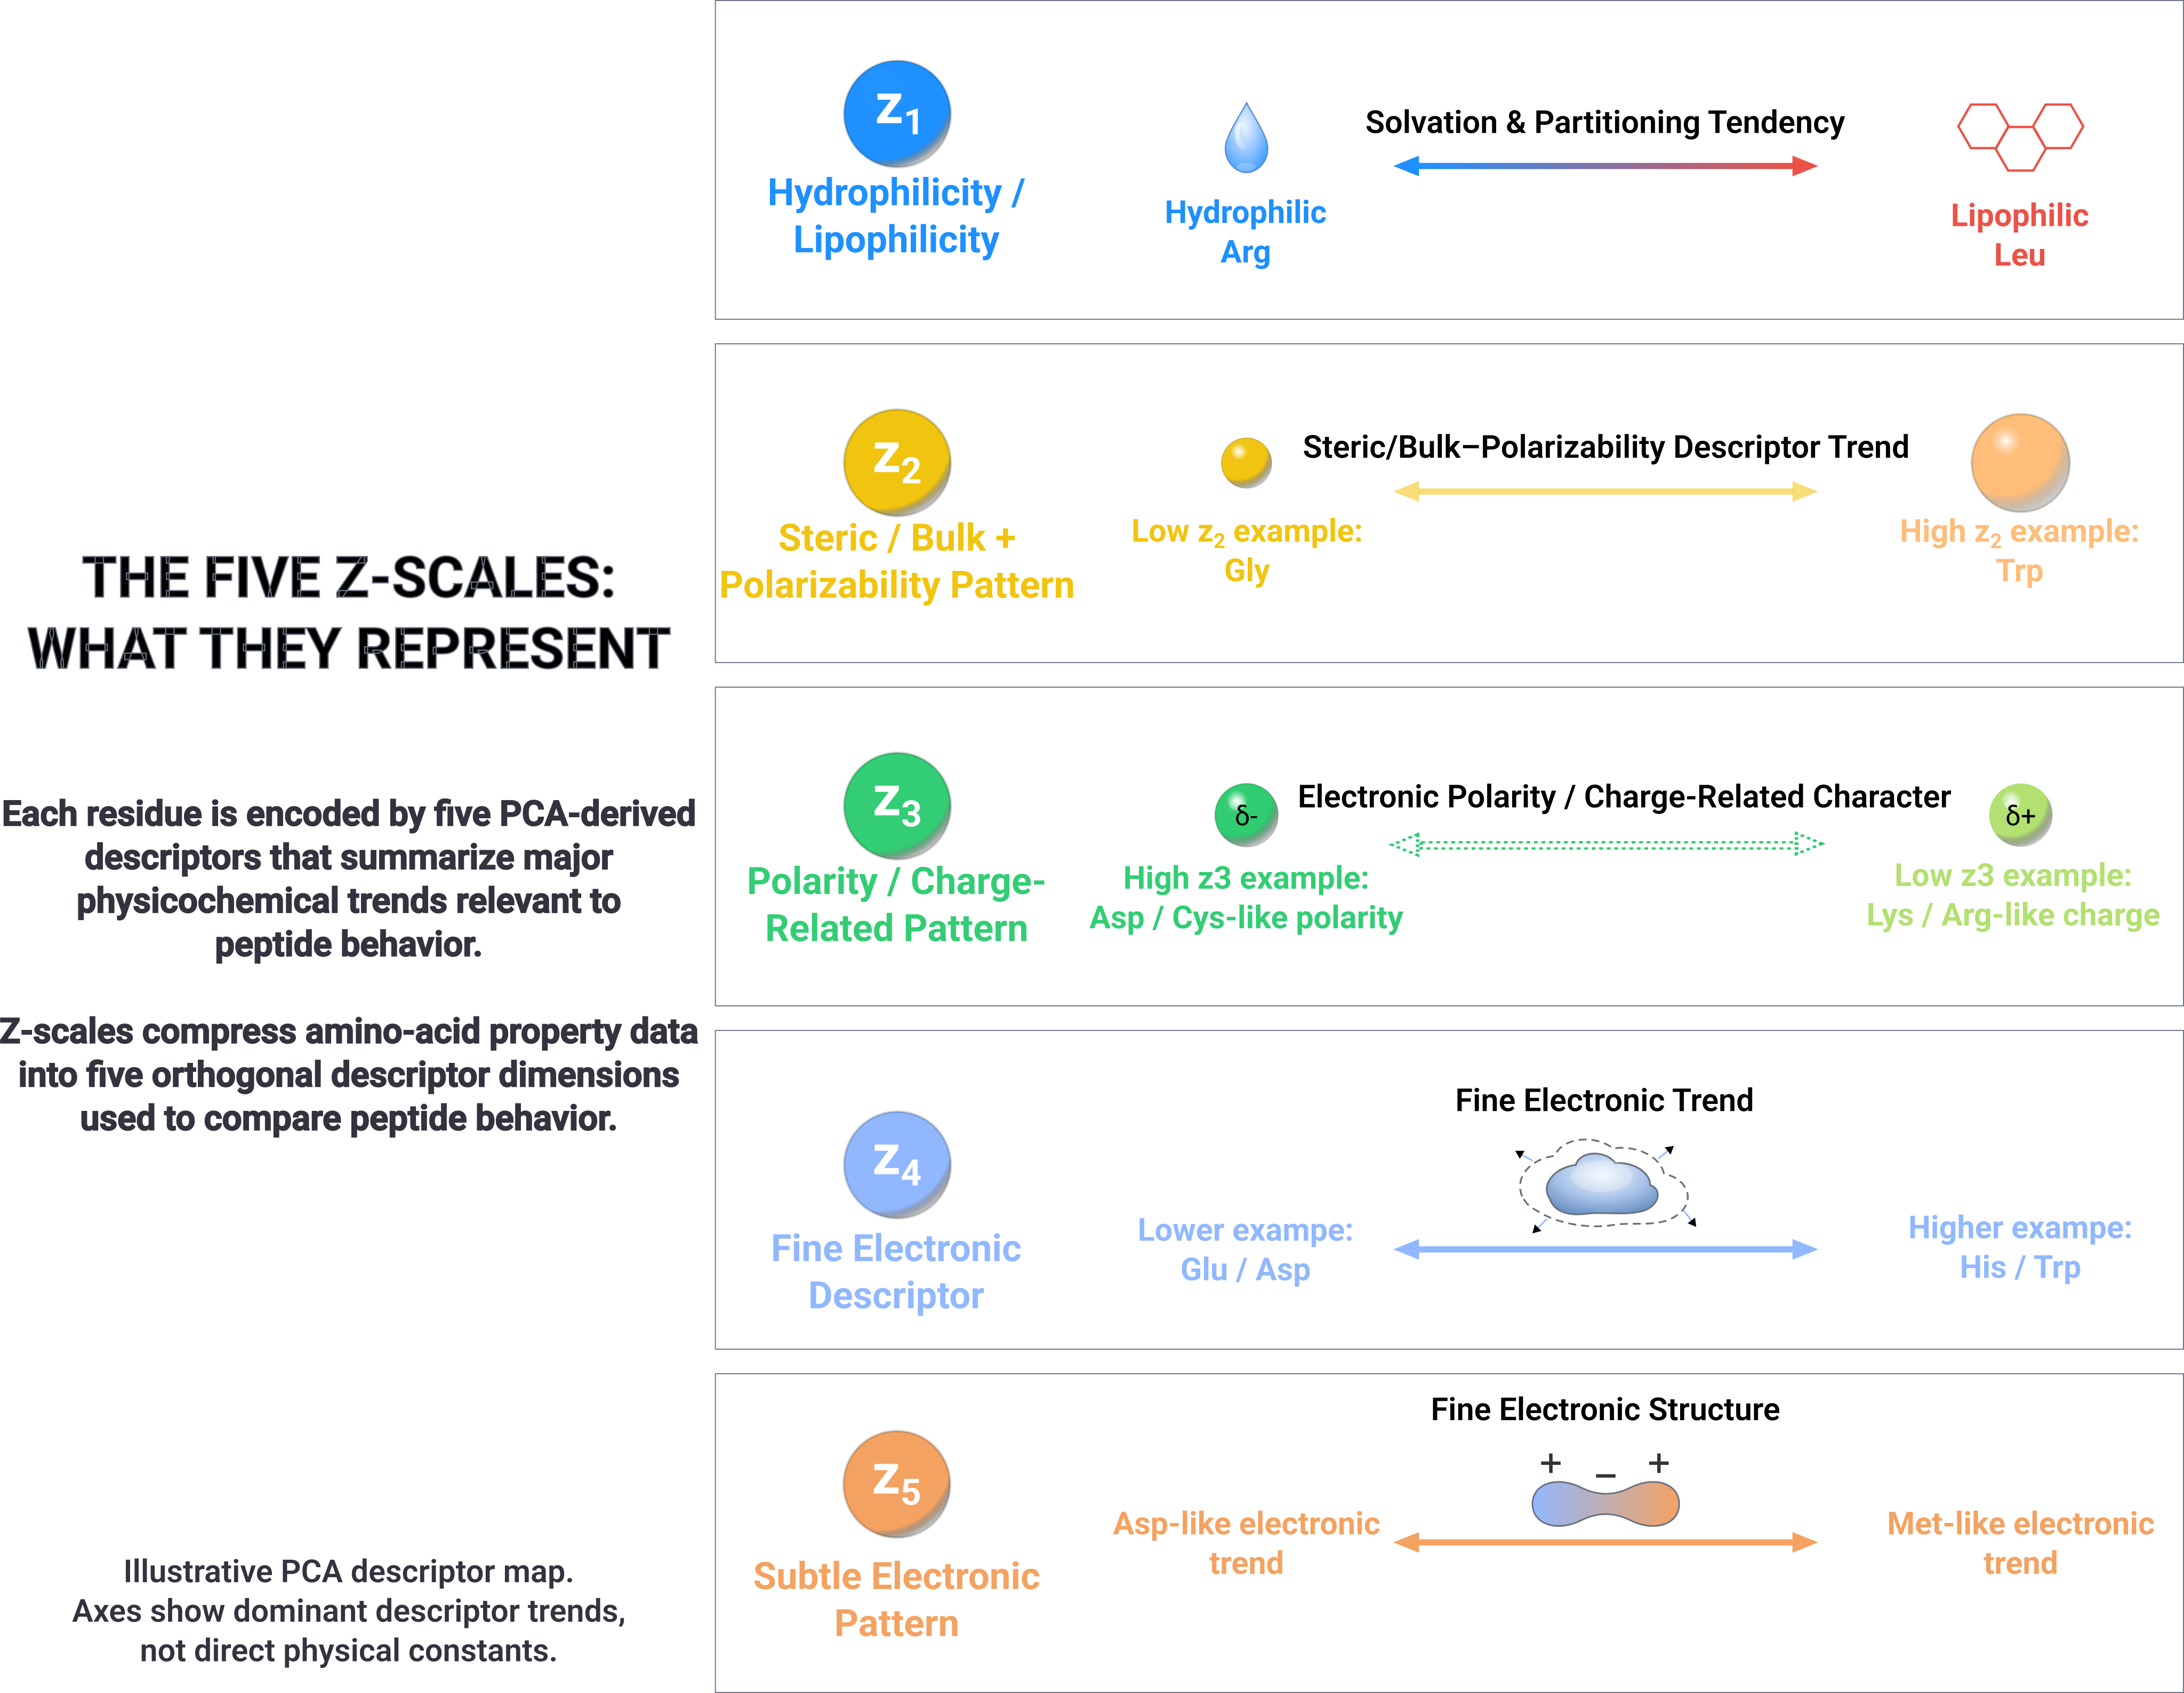
z1: Hydrophilicity / Hydrophobicity
The first component, z1, is usually interpreted as the dominant hydrophilicity / hydrophobicity axis. In practical terms, it helps describe how strongly a residue tends toward polar versus less polar behavior within the descriptor space. The Sandberg descriptors were built partly from chromatographic retention data and related physicochemical variables, so z1 is not an arbitrary label. Standard Z-scale summaries therefore interpret z1 as the hydrophobicity / hydrophilicity dimension.
From a practical interpretation standpoint, z1 can be treated as a compressed descriptor of hydrophobic / hydrophilic behavior. It should not be interpreted as a literal transfer free energy, even though it reflects physicochemical information related to retention and solvent-dependent behavior. In RP-HPLC, peptide retention is strongly influenced by hydrophobic interactions, although retention is also modulated by charge state, pH, ion-pairing conditions, sequence conformation, and the stationary phase. That is why z1 can support early retention expectations, but it should not be used alone for gradient design.
So the practical reading is cautious: a strongly hydrophobic local segment may increase RP retention and make handling less forgiving, while a strongly hydrophilic segment may reduce retention. But z1 should still be read together with charge, terminal state, ion-pairing conditions, and sequence context. A highly ionized peptide can behave very differently from a neutral peptide with a similar hydrophobic trend.
z2: Steric Bulk / Polarizability
The second component, z2, is usually interpreted as the steric / bulk property axis, with a polarizability contribution. That wording matters. z2 is not “volume in disguise.” It is a PCA-derived descriptor that summarizes steric/bulk and polarizability-related variation within the Sandberg property matrix.
For peptide synthesis, the most useful bench interpretation is cautious and heuristic. Amide bond formation depends not only on activation chemistry, but also on whether the reacting nucleophile remains sterically accessible. Standard peptide-coupling guidance has long emphasized that successful coupling depends on both reagent reactivity and steric accessibility of the reacting amine, and steric hindrance can contribute to poor conversion in difficult couplings. For that reason, local z2 patterns can support coupling-risk interpretation, but z2 should not be treated as a direct mechanistic proxy for coupling rate or coupling failure.
This is where Z-scales can add information beyond a plain hydropathy score. A peptide can have a moderate overall GRAVY value and still be difficult to elongate if a short stretch concentrates sterically demanding or aggregation-prone residues. In other words, the synthesis problem may involve local steric/bulk patterning rather than global hydrophobicity alone. That is why a rolling z2 profile can be useful for coupling-risk triage, provided it is interpreted together with residue identity, aggregation risk, and empirical synthesis data.
A practical local summary can be written as:
\[\overline{z}_2(r,w)=\frac{1}{w}\sum_{i=r}^{r+w-1} z_{2,i}\]where w is the window length. A local z2 profile does not prove a failed coupling. It should be read as a descriptor pattern that may flag unusual steric/bulk and polarizability features, especially when it overlaps with known difficult motifs, aggregation-prone regions, or empirically poor coupling steps.
z3, z4, z5: Electronic Fine Structure
The remaining three components describe polarity and progressively subtler electronic-related effects after PCA compression. Standard Z-scale summaries often treat z3 as polarity or electronic polarity/charge, while z4 and z5 capture finer electronic effects. These assignments are chemically useful, but they are less directly interpretable at the bench than z1 or z2 and should be handled with more caution.
The reason is that these axes are further removed from direct bench observables. A chemist may compare a strong z1 trend with retention behavior, although retention also depends on charge state, ion-pairing conditions, conformation, and stationary phase. A z2 pattern can be compared with known difficult motifs or observed coupling outcomes, but it should not be treated as a standalone synthesis predictor. z3 to z5 usually become most valuable when comparing analogue series, fitting QSAR models, or explaining why residues with similar size and hydropathy still behave differently in target recognition. In that sense, they are not “soft” variables. They are just less directly observable.
For receptor binding and peptide-protein recognition, these descriptors can help encode differences in side-chain polarity, charge distribution, and electronic responsiveness that are missed by simple hydropathy scales. But the strongest claims here should remain modest. The use of z3, z4, and z5 for interpreting fine binding selectivity is best classified in a general article as useful and well established in descriptor-based modeling, but still target-dependent and not universally mechanistic in the same way as chromatographic hydrophobicity.
So the working chemist can read the Z-space like this:
- z1 asks: How strongly does this residue pull the sequence toward polar or nonpolar behavior?
- z2 asks: What steric/bulk and polarizability pattern is this residue adding to the sequence?
- z3–z5 ask: What polarity and finer electronic signature remains after the dominant hydrophobicity and steric/bulk trends have been accounted for?
That is the practical logic of the framework. The first two axes often support interpretation of hydrophobicity- and steric/bulk-related behavior. The later axes can help explain why closely related analogues stop behaving the same way in QSAR or target-interaction models.
For practical peptide work, the most useful starting point is not the abstract PCA (Principal Component Analysis) discussion but the actual residue matrix. The table below gives the 5D Z-scale coordinates for the 20 coded amino acids in the Sandberg framework. These values are widely reused in peptide descriptor libraries and later QSAR summaries. A few reading rules help avoid confusion. In this Z-scale convention, negative z1 values indicate more lipophilic residues, while positive z1 values indicate more hydrophilic residues. z2 summarizes steric/bulk and polarizability-related variation, z3 captures polarity, and z4 to z5 capture finer electronic effects. These values are descriptor coordinates, not direct physical constants, so they should be used for comparison, profiling, and modeling rather than read as standalone observables.
| Residue | Name | z1 | z2 | z3 | z4 | z5 |
|---|---|---|---|---|---|---|
| A | Alanine | 0.24 | -2.32 | 0.60 | -0.14 | 1.30 |
| R | Arginine | 3.52 | 2.50 | -3.50 | 1.99 | -0.17 |
| N | Asparagine | 3.05 | 1.62 | 1.04 | -1.15 | 1.61 |
| D | Aspartic acid | 3.98 | 0.93 | 1.93 | -2.46 | 0.75 |
| C | Cysteine | 0.84 | -1.67 | 3.71 | 0.18 | -2.65 |
| Q | Glutamine | 1.75 | 0.50 | -1.44 | -1.34 | 0.66 |
| E | Glutamic acid | 3.11 | 0.26 | -0.11 | -3.04 | -0.25 |
| G | Glycine | 2.05 | -4.06 | 0.36 | -0.82 | -0.38 |
| H | Histidine | 2.47 | 1.95 | 0.26 | 3.90 | 0.09 |
| I | Isoleucine | -3.89 | -1.73 | -1.71 | -0.84 | 0.26 |
| L | Leucine | -4.28 | -1.30 | -1.49 | -0.72 | 0.84 |
| K | Lysine | 2.29 | 0.89 | -2.49 | 1.49 | 0.31 |
| M | Methionine | -2.85 | -0.22 | 0.47 | 1.94 | -0.98 |
| F | Phenylalanine | -4.22 | 1.94 | 1.06 | 0.54 | -0.62 |
| P | Proline | -1.66 | 0.27 | 1.84 | 0.70 | 2.00 |
| S | Serine | 2.39 | -1.07 | 1.15 | -1.39 | 0.67 |
| T | Threonine | 0.75 | -2.18 | -1.12 | -1.46 | -0.40 |
| W | Tryptophan | -4.36 | 3.94 | 0.59 | 3.44 | -1.59 |
| Y | Tyrosine | -2.54 | 2.44 | 0.43 | 0.04 | -1.47 |
| V | Valine | -2.59 | -2.64 | -1.54 | -0.85 | -0.02 |
For sequence work, this table acts as the lookup layer behind later sequence transforms. Once each residue is mapped to its (z1, z2, z3, z4, z5) coordinate, the peptide can be summarized by averages, rolling windows, cross-covariance terms, or fixed-length sequence transforms such as ACC. In Peptalyzer™, the Z-scale table surfaces per-axis residue values together with whole-sequence mean, standard deviation, and observed min–max range for each axis. That is why the reference matrix itself belongs in the article: without it, the later profile mathematics is harder to interpret.
The Chemist’s Perspective: Interpreting Bench Risk
Z-scales become most useful when they stop looking like descriptor theory and start working as bench triage tools. At that point, the chemist no longer asks only, “What is the average property of this peptide?” but instead asks, “Where might this sequence become difficult to synthesize, handle, dissolve, or purify?” That shift matters because many difficult syntheses involve local sequence effects, not only whole-sequence averages. Steric congestion, aggregation-prone motifs, and short lipophilic patches can all create regional problems. Chromatographic behavior also reflects how the peptide interacts with solvent, ion-pairing conditions, and the stationary phase, not how an isolated side chain behaves alone. Sandberg’s Z-scales fit that broader physicochemical logic because they were derived from chromatographic retention data, NMR variables, and calculated descriptors rather than a single hydropathy list.
Identifying Steric/Bulk Patterns: Local z2 Profiles as Warning Signals
In Fmoc-SPPS, coupling efficiency depends on more than reagent strength. It also depends on whether the growing resin-bound amine remains accessible and whether the resin-bound peptide is aggregated, poorly solvated, or conformationally constrained. Difficult sequences often involve a mixture of steric hindrance, aggregation, hydrogen-bonded structure, reduced reagent penetration, and incomplete coupling or deprotection. These effects can lead to truncated peptides and deletion sequences.
A practical screening view is a signed rolling z2 profile, preferably interpreted together with an absolute-deviation profile. The signed z2 profile helps show the direction of the steric/bulk-polarizability pattern, while the absolute-deviation view helps flag unusual local regions without assuming that only positive z2 values are problematic. Or, if you want a length-normalized view,
\[\overline{z}_2(r,w)=\frac{1}{w}\sum_{i=r}^{r+w-1} z_{2,i}\]where r is the window start and w is the window length. This local z2 summary does not prove that a coupling will fail, and a raw signed sum should not be treated as a universal steric-risk score. It is most useful as a pattern-recognition tool when interpreted together with residue identity, known difficult motifs, aggregation risk, resin behavior, and empirical coupling data. It should be treated as a descriptor-based warning pattern that may become relevant when it overlaps with known difficult motifs, aggregation-prone regions, or empirically weak coupling steps. That is the practical bridge from descriptor space to synthesis triage.
Difficult motifs are often local, not global. Do not trust a “moderate” whole-sequence average when a short segment contains a strong steric/bulk pattern, aggregation-prone residues, or known difficult motifs. A peptide can show acceptable overall hydropathy and still accumulate deletion products if one local region slows coupling or deprotection enough for incomplete conversion to propagate.
This is the chemist’s trap: relying on whole-sequence hydropathy while ignoring a short difficult segment. In practice, bulky aromatic motifs, branched aliphatic residues, aggregation-prone stretches, and hydrogen-bonded structure can all contribute to poor sequence assembly. Z-scales do not replace coupling analytics, test cleavages, LC-MS monitoring, or resin-behavior observations, but they can help decide where to monitor more aggressively and where stronger coupling chemistry may be worth scouting.
Solubility and Partitioning: Using z1/z3 Patterns to Guide Solvent Scouting
Here Z-scales help best as a decision aid, not as a universal solvent rule. z1 captures the dominant hydrophilicity / hydrophobicity trend, while z3 captures polarity-related variation. Together, they can help frame two common solubility hypotheses that a simple GRAVY value may merge: poor aqueous solubility driven by hydrophobic sequence character, and poor apparent solubility driven by aggregation or self-association. Sandberg’s framework supports this cautious interpretation because the descriptor space includes chromatographic, NMR, and calculated physicochemical information, not just bulk hydropathy.
This is a bench heuristic derived from descriptor patterning and practical peptide-handling experience, not a direct Z-scale law. When a segment shows strongly hydrophobic z1 behavior and limited polarity compensation, the peptide may behave like a hydrophobic material. In that case, an organic cosolvent such as DMF, acetonitrile, methanol, isopropanol, or small amounts of DMSO can be rational scouting options when compatible. For free Cys-containing or oxidation-sensitive peptides, avoid treating DMSO as the default first choice.
When the peptide does not look extremely hydrophobic overall but still self-associates, the problem may shift from simple partitioning to intermolecular association. In that case, denaturing additives such as urea or guanidinium hydrochloride can be rational scouting options for aggregation-prone peptides, although they may interfere with biological assays and downstream workflows.
So the working heuristic is:
- Strong hydrophobic z1 pattern with low charge or limited polarity compensation: scout organic cosolvents first.
- Moderate hydrophobicity but strong evidence of self-association, gelation, or aggregation: scout denaturing additives such as urea or guanidinium hydrochloride, if compatible.
- Mixed case: scout both approaches on a small aliquot and check compatibility with LC-MS, purification, and the downstream assay.
That solvent advice is an inference from descriptor behavior plus practical solubility guidance. It is useful, but it is not a law. The peptide’s net charge, terminal state, concentration, oxidation-sensitive residues, and assay constraints still matter enough that solvent scouting should remain empirical. Peptide-handling guides consistently emphasize that solubility is sequence-dependent and that solvent choice often requires small-scale testing.
Backbone vs. Side Chain: Why Z-Scales Reflect Effective Solvent-Mediated Properties
This point is easy to miss and worth stating clearly. Z-scales do not describe an amino-acid side chain as an isolated gas-phase object. They describe residue behavior after multivariate compression of experimentally relevant and calculated variables. In the Sandberg expansion, those variables included retention values from seven TLC systems, NMR shift variables, surface-area terms, van der Waals side-chain volume, logP, and semiempirical molecular-orbital indices. That design makes the descriptor space more chemically grounded than a single hydropathy list, but it still remains a descriptor system rather than a direct solvent model.
That is also why Z-scales can feel more chemically grounded than single hydropathy scales. RP-HPLC retention is strongly influenced by hydrophobic interactions, but peptide charge state, ion-pairing reagent, mobile-phase acidity, conformation, stationary phase, and organic modifier can substantially change retention and peak shape. Even small residue changes can shift retention because the peptide presents a different effective surface to the chromatographic system. In other words, chromatography reports system-dependent peptide behavior, not an isolated side-chain constant.
The same principle appears in peptide-resin behavior. Peptide-resin solvation depends on solvent polarity, donor-acceptor properties, resin swelling, peptide aggregation, and sequence context, not just one crude hydrophobicity axis. So when Z-scales help frame “sticky” purification, aggregation on resin, or solvent-rescue hypotheses, they work because they encode part of that broader physicochemical information. They do not solve the whole problem, but they can help start from a richer descriptor picture.
What the Bench Chemist Should Actually Do
Use z2 patterns locally, not as a global steric score. Use z1 as a hydrophobicity / hydrophilicity clue, not a complete solubility answer. Treat z3 as a polarity-related descriptor that may modify the simple hydropathy story. That mindset keeps Z-scales in their most useful role: not as decorative QSAR math, but as a way to ask better pre-synthesis and pre-purification questions before you commit reagents, resin time, and purification effort.
Practical Workflow: Using Z-Scales in Synthesis Design
Z-scales become useful when they help frame a lab choice before the first coupling or before the first scouting purification. The key is to stop treating the peptide as one average descriptor and instead inspect local Z-patterns. In practice, z2 patterns can inform coupling-risk triage, z1 can support early RP-HPLC scouting expectations, and position-wise Z-loadings can help prioritize which analogues are worth making next. That is the workflow value of the system.
Pre-Synthesis Audit: Use Local z2 Patterns Before Escalating Coupling Conditions
Start with a rolling descriptor screen, not with reagent habit alone. A simple local metric is:
\[P_{z_2}(r,w)=\sum_{i=r}^{r+w-1} z_{2,i}\]where r is the window start and w is the window size. A local z2 pattern can justify earlier scouting of strengthened coupling conditions, but this remains a heuristic and should be interpreted together with aggregation risk, residue identity, resin behavior, and empirical monitoring. DIC/Oxyma is a common first-line option for many Fmoc-SPPS couplings, especially when low-racemization activation is desired, but reagent choice still depends on residue sensitivity, steric demand, resin behavior, and the target sequence. For known difficult segments, hindered residues, or empirically weak couplings, more reactive or alternative activation systems such as HATU, HCTU, PyBOP, or carefully selected OAt/HOAt-based conditions may be worth scouting. This should be balanced against racemization risk, residue sensitivity, EHS constraints, and downstream analytical compatibility. That does not mean HATU/HOAt is always better. It means a suspicious local descriptor pattern can be one reason to test stronger conditions earlier rather than waiting until deletion products dominate.
A practical bench rule is cautious. Use DIC/Oxyma as a default option when the sequence looks chemically normal and racemization control matters. Consider stronger or alternative coupling conditions when a suspicious z2 pattern overlaps with residues you already distrust in SPPS, such as bulky aromatics, branched aliphatics, N-methyl residues, Aib-rich regions, or a segment that also looks aggregation-prone. In other words, let the local descriptor map support reagent scouting rather than decide the reagent choice by itself.
Statistical Design of Experiments: Select Representative Analogues in Z-space
Z-scales are especially useful when you do not want to synthesize an entire analogue space. In peptide QSAR and QSAM work, each varied position can be encoded by its Z-values, and D-optimal design has been used to select smaller training sets from larger peptide spaces. One published elastase-substrate example described two varied positions by the five Sandberg Z-scales, giving 10 variables, and selected 32 peptides from 89 candidates as a D-optimal training set, with the remaining peptides used for external testing. Related peptide studies have also used multivariate or constrained design strategies to select representative analogue sets before PLS modeling.
That is the practical lesson for analogue design. Do not choose analogues only by amino-acid identity or by simple Ala scans. Choose analogues that spread across the local Z-space: one that shifts z1, one that shifts z2, one that changes polarity or electronic terms, and one that stays near the center as a control. That gives you a chemically broader library with fewer peptides, which is one goal of a good DoE strategy.
Optimizing Purification: Use the z1 Profile to Guide RP-HPLC Scouting
RP-HPLC of peptides is strongly influenced by hydrophobic interactions with the stationary phase, organic-modifier strength, charge state, ion-pairing conditions, peptide conformation, and stationary-phase chemistry. A practical starting method therefore depends partly on the peptide’s hydrophobicity, but not on hydrophobicity alone. General peptide HPLC guides often recommend broad initial scouting gradients and then compression or shifting of the gradient after the first chromatogram shows where the peptide and impurities elute.
That maps cautiously onto z1 profiling. If the sequence shows a strongly hydrophobic z1 pattern, later elution may be more likely, and a broader or stronger scouting gradient may be reasonable. If the peptide remains relatively polar across the sequence, an earlier or shallower scouting window may be reasonable. The goal is not to predict the exact retention time from z1 alone. The goal is to avoid starting with a gradient that is clearly mismatched to the expected hydrophobic footprint of the sequence.
Ion-pairing choice belongs in the same scouting logic, but it should not be chosen from z1 alone. TFA remains a common starting additive for peptide RP-HPLC, often around 0.05 to 0.1%, because it improves ion pairing and peak shape. More hydrophobic ion-pairing reagents can increase retention and change selectivity, especially for basic peptides, but they also introduce tradeoffs in method transfer, retention time, selectivity, and MS compatibility. For LC-MS-driven workflows, volatile alternatives such as formic acid or lower-TFA methods are often considered because TFA is well known to suppress MS response.
Hotspot Identification: Focus Optimization Where Z-Effects Are Largest
Once you have even a modest activity, purity, or recovery dataset, avoid mutating the sequence evenly by habit. Fit the data and inspect the position-wise coefficients, feature effects, or model contributions. In peptide QSAR studies using Z-descriptors, position-wise terms and their coefficients have been used to identify which residue positions contribute most strongly to the model. That is the right logic for optimization: not every residue deserves the same amount of chemistry effort.
In practice, a hotspot is any position where a change in Z-space is associated with a large model response. If a position carries a strong z1-related coefficient, you may be tuning hydrophobicity, partitioning, or hydrophobic contact. If it carries a strong z2-related coefficient, you may be tuning steric/bulk or polarizability-related effects. And if the important term sits in z3 to z5, that is a sign that simple hydropathy replacement may miss the real driver. The workflow benefit is practical: you can focus substitutions where the model suggests chemistry matters, instead of spreading effort across positions that appear mostly silent.
What All This Means in Practice
A workable Z-scale workflow looks like this:
- Screen the sequence for local z2 patterns before synthesis.
- Use DIC/Oxyma as a reasonable default when racemization control and standard coupling efficiency are priorities, then scout stronger or alternative coupling conditions when descriptor patterns overlap with known difficult motifs or weak empirical coupling steps.
- Use the z1 profile to guide the first RP-HPLC scouting window, not to predict retention time directly.
- Change ion-pairing conditions only when retention, peak shape, selectivity, or MS compatibility require it.
After the first data cycle, use position-wise Z-effects, coefficients, or model contributions to decide where the next round of analogues should go. That is a tighter loop than “make a full library and hope the chromatography behaves.”
Beyond the 20: A Note on Noncanonical Z-Scale Extensions
The original Hellberg Z-scale framework described the 20 coded amino acids using three principal properties. Sandberg later expanded that logic to a five-component descriptor set covering 87 amino acids. That expansion made it possible to place many noncanonical residues, including examples such as Cha and Cit, into the same multivariate property space as coded amino acids, rather than treating them only as vague “hydrophobic” or “polar” analogues. In Peptalyzer™, this 87-amino-acid framework is scientific background; runtime support is limited to residues that currently have direct Z-scale vectors in the app table.
For residues that are not part of the published reference set, a compatible approach is virtual characterization: define the residue structure, calculate or estimate the same underlying descriptor variables, apply the same preprocessing and scaling, and project those values through the existing loading matrix. The resulting z1 to z5 values are provisional and should be labeled as approximations. This is useful for comparative modeling, but it remains an approximation and should be interpreted with caution. In current Peptalyzer™ behavior, this virtual projection step is not applied at runtime: if any sequence token lacks a direct Z-scale vector, the Z-scale output is marked unsupported for that sequence.
For the full Peptalyzer™ logic on noncanonical residues, support levels, and approximation rules used in Peptalyzer™, see the dedicated article: Noncanonical Amino Acids in Peptalyzer™ Calculations.
Z-Scale Peptide Descriptors — FAQ
Because PCA axes can be sign-flipped without changing the underlying component structure. What matters is internal consistency within one Z-scale system, not the sign alone.
Published Z-scale tables describe residue descriptors, but they do not by themselves encode the full conformational consequences of chirality in a peptide sequence. D-residues usually require model-specific handling or separate parameterization.
Not directly. They can help localize patterns associated with hydrophobicity, steric/bulk effects, polarity, and electronic variation, but aggregation still depends on sequence patterning, concentration, solvent, charge state, and structure.
No. They are multivariate descriptors derived from a larger property matrix. Use them for comparison and modeling, not as direct observables.
Use them only as a first summary. Local windows are often more useful for synthesis and purification triage because many difficult behaviors arise from regional sequence patterns.
Yes in general peptide interpretation. In current Peptalyzer™ Z-scale output, active terminal modifications are explicitly excluded from Z-scale descriptors (Z1–Z5), means, standard deviations, ranges, and conclusion patterns; the computation is residue-only.
Not always. Z-scales often give a useful balance between chemical detail and manageable model size, but descriptor performance depends on the dataset, endpoint, validation strategy, and model type.
Yes, when direct compatible Z-scale vectors are available for the residues being analyzed. In current Peptalyzer™ behavior there is no projection/approximation fallback: missing direct values make Z-scale output unsupported for that sequence. For support rules, see Noncanonical Amino Acids in Peptalyzer™ Calculations.
They can help prioritize substitutions, especially in analogue series or QSAR models, but they do not decide alone. Synthesis risk, purification behavior, assay goals, and experimental data still matter.
References
Foundational Z-scale framework
Akinori Kidera, Yasuo Konishi, Masahito Oka, Tatsuo Ooi, & Harold A. Scheraga. (1985). Statistical analysis of the physical properties of the 20 naturally occurring amino acids. Journal of Protein Chemistry, 4(1), 23–55.
- Early multivariate amino-acid descriptor paper that established the general PCA logic later refined in peptide QSAR descriptor systems.
- DOI: 10.1007/BF01025492
Sven Hellberg, Michael Sjöström, Bert Skagerberg, & Svante Wold. (1987). Peptide quantitative structure-activity relationships, a multivariate approach. Journal of Medicinal Chemistry, 30(7), 1126–1135.
- Foundational Z-scale paper introducing the principal-property approach (z1–z3) for peptide QSAR and analogue design.
- DOI: 10.1021/jm00390a003
Maria Sandberg, Lennart Eriksson, Jörgen Jonsson, Michael Sjöström, & Svante Wold. (1998). New chemical descriptors relevant for the design of biologically active peptides. A multivariate characterization of 87 amino acids. Journal of Medicinal Chemistry, 41(14), 2481–2491.
- Core reference for the 5D Sandberg Z-scales and the extension from the 20 coded residues to a broader amino-acid space.
- DOI: 10.1021/jm9700575
Applications, interpretation, and later evaluation
K. J. Siebert. (2001). Quantitative structure-activity relationship modeling of peptide and protein behavior as a function of amino acid composition. Journal of Agricultural and Food Chemistry, 49(2), 851–858.
- Useful supporting reference for composition-based peptide/protein QSAR and for explaining how residue descriptors can be aggregated into sequence-level models.
- DOI: 10.1021/jf000718y
Gerard J. P. van Westen, Jörg K. Wegner, Adriaan P. IJzerman, Herman W. T. van Vlijmen, & Andreas Bender.(2011). Proteochemometric modeling as a tool to design selective compounds and for extrapolating to novel targets. MedChemComm, 2(1), 16–30.
- Helpful review for the broader modeling context in which amino-acid descriptors such as Z-scales are used for sequence-activity and target-interaction modeling.
- DOI: 10.1039/C0MD00165A
Mark H. Barley, Nicholas J. Turner, & Royston Goodacre. (2018). Improved descriptors for the quantitative structure-activity relationship modeling of peptides and proteins. Journal of Chemical Information and Modeling, 58(2), 234–243.
- Modern descriptor paper that is useful for the “Goldilocks zone” discussion, especially when comparing compact interpretable descriptors with more complex alternatives.
- DOI: 10.1021/acs.jcim.7b00488
Peng Zhou, Qian Liu, Ting Wu, Qiong Miao, Shuyong Shang, Hong Wang, Zhi Chen, Shanshan Wang, & Hao Wang.(2021). Systematic comparison and comprehensive evaluation of 80 amino acid descriptors in peptide QSAR modeling. Journal of Chemical Information and Modeling, 61(4), 1718–1731.
- Strong benchmarking paper for comparing Z-scales with other amino-acid descriptor families such as VHSE and related sets.
- DOI: https://doi.org/10.1021/acs.jcim.0c01370
J. Emonts, & J. F. Buyel. (2023). An overview of descriptors to capture protein properties – Tools and perspectives in the context of QSAR modeling. Computational and Structural Biotechnology Journal, 21, 3234–3247.
- Good review-level support for positioning Z-scales within the wider landscape of sequence and protein descriptor methods.
- DOI: 10.1016/j.csbj.2023.05.022