Hydrophobicity scales are foundational to peptide and protein science, but not all scales measure the same physical reality. While empirical scales like Kyte-Doolittle are excellent for estimating general aqueous solubility and folded hydrophobic cores, the Wimley-White scale serves a much more specific biophysical purpose: calculating the thermodynamic free energy of membrane partitioning.
For peptide chemists designing antimicrobial peptides (AMPs), cell-penetrating peptides (CPPs), or liposomal formulations, understanding whether a sequence will rest in the aqueous buffer, anchor to the lipid surface, or plunge through the bilayer is critical. The Wimley-White scale provides the rigorous thermodynamic math required to make those predictions.
Predict Membrane Partitioning with Peptalyzer™
Use Peptalyzer™ to calculate strict thermodynamic transfer energies (ΔG°) and identify surface-anchoring or transmembrane domains before beginning your synthesis or formulation.
📘 What will you learn here?
Principle of the Wimley-White Scale: Interfacial vs. Octanol Partitioning
Bio-Predictive Disclaimer: The Wimley-White scale calculates the thermodynamic transfer free energy (ΔG°) of lipid partitioning. While a strong affinity for membranes often correlates with antimicrobial or cell-penetrating activity, this is a physical measurement, not a direct biological prediction. True in vivo efficacy is subject to complex cellular variables, including active transport and receptor-mediated endocytosis.
The Wimley-White scale assigns each amino acid a transfer free energy value (ΔG°) expressed in kcal/mol. These values are defined for the 20 canonical amino acids based on experimental host–guest measurements. In Peptalyzer™, noncanonical residues are included only when a compatible transfer free energy can be assigned through curated residue-library metadata. This may involve conservative approximation using a chemically justified canonical analog, but such mappings should be interpreted with caution due to the strict thermodynamic nature of the scale. If any residue lacks a defensible Wimley–White value, the profile is marked unavailable for that mode/sequence (not computed by excluding residues). Full details of support levels and assumptions are provided in the noncanonical amino acids guide.
Unlike statistical indices, these values for canonical amino acids were experimentally derived using host-guest pentapeptide systems to measure actual phase partitioning. A critical distinction for any researcher is that the Wimley-White “scale” is actually a set of two distinct thermodynamic measurements. While both provide transfer free energy (ΔG°) values, they represent two very different physical environments within a cell membrane.
The Interfacial Scale (POPC)
This scale measures the energy required to move a peptide from water to the zwitterionic interface of a lipid bilayer. This is the default scale used in Peptalyzer™.
- Best For: Analyzing antimicrobial peptides (AMPs), cell-penetrating peptides (CPPs), and surface-active toxins.
- The “Surface Anchor” Effect: This scale highlights residues like Tryptophan (W) and Tyrosine (Y), which have a massive thermodynamic preference for the lipid-water interface rather than the deep hydrophobic core.
The Octanol Scale
This scale measures the transfer from water to bulk n-octanol, a solvent that mimics the deep, completely non-polar hydrocarbon interior of the membrane.
- Best For: Stability studies of fully buried transmembrane (TM) α-helices and predicting hydrophobic protein cores.
- The Difference: In octanol, the specialized chemical interactions of the lipid headgroups are absent. Therefore, residues that provide “anchoring” at the surface (like W and Y) show significantly different energy profiles when forced into the deep core.
The Peptide Backbone Cost
The Wimley-White scale is unique because it is a whole-residue scale. Moving a highly polar, hydrogen-bonding peptide amide bond from water into a lipid environment requires significant energy (≈+1.15 kcal/mol). The Wimley-White values factor this substantial thermodynamic penalty directly into the calculation, making it vastly superior to side-chain-only scales for predicting real-world membrane insertion.
Wimley-White Scale Interfacial Values for Amino Acids
The following table lists the experimentally determined transfer free energy (ΔG°) values for all 20 standard amino acids, measured at pH 8.0. These values represent the energetic cost or gain of moving a whole residue (including the peptide backbone) from an aqueous environment into a POPC lipid bilayer interface.
| Amino Acid | 1-Letter Code | Transfer Free Energy (kcal/mol) |
|---|---|---|
| Alanine | A | +0.17 |
| Arginine | R | +0.81 |
| Asparagine | N | +0.42 |
| Aspartic Acid | D | +1.23 |
| Cysteine | C | -0.24 |
| Glutamic Acid | E | +2.02 |
| Glutamine | Q | +0.58 |
| Glycine | G | +0.01 |
| Histidine | H | +0.96 |
| Isoleucine | I | -0.31 |
| Leucine | L | -0.56 |
| Lysine | K | +0.99 |
| Methionine | M | -0.23 |
| Phenylalanine | F | -1.13 |
| Proline | P | +0.45 |
| Serine | S | +0.13 |
| Threonine | T | +0.14 |
| Tryptophan | W | -1.85 |
| Tyrosine | Y | -0.94 |
| Valine | V | +0.07 |
Notice that Arginine (+0.81) is less penalized than Lysine (+0.99) in this scale; this is due to the guanidinium group’s unique ability to hydrogen-bond with lipid phosphate headgroups.
How Peptalyzer™ Calculates the Wimley-White Scale Profile
Most bioinformatics tools reduce hydrophobicity to a statistical “mean average.” Peptalyzer™ treats the Wimley-White scale as a thermodynamic sum of experimentally derived residue contributions, preserving its physical interpretation within the limits of available residue data.
Here is the exact step-by-step logic used in the tool:
1. The Additive Sum: Peptalyzer™ uses a sliding window (defaulting to 9 or 19 residues). Instead of averaging the values, it calculates the total Gibbs Free Energy of transfer for that specific window:
\[\Delta G^\circ_{window} = \sum_{i=1}^{n} \Delta G^\circ_i\]2. Terminal Charge Penalties: Dragging a free amine (−NH3+) or free carboxylic acid (−COO−) into a lipid phase carries a massive thermodynamic penalty. If your sliding window includes an uncapped N-terminus or C-terminus, Peptalyzer™ automatically adds the corresponding energetic resistance (+1.15 or +1.20 kcal/mol) to the window’s total ΔG°.
3. Dynamic Window Sizing: Because membrane interaction is heavily dependent on 3D geometry, Peptalyzer™ allows you to select the physically relevant window size:
- 9-Residue Window (Surface Anchor): Perfectly captures the 2–3 helical turns necessary to form an amphipathic anchor at the lipid headgroup interface.
- 19-Residue Window (Transmembrane): Captures the exact length required for an α-helix to physically span the 30 Å hydrophobic core of a standard bilayer.
- Auto-Shrink Fallback: To ensure a meaningful profile, Peptalyzer™ requires a sequence to be at least 3 residues longer than the selected window (e.g., 12 residues for a 9-window). If the sequence is shorter, the tool defaults to a single-bar Total Sequence Analysis.
Total Sequence ΔG°: The Wimley-White Scale Equivalent to GRAVY
While the sliding window profile shows you exactly where a peptide interacts with a lipid bilayer, Peptalyzer™ also calculates a Total Sequence ΔG° for the entire molecule.
You can think of this as the Wimley-White equivalent to the GRAVY score, with one major mathematical difference: GRAVY is an average, but ΔG° is a strict sum. Because thermodynamic energy is additive, pushing a 20-mer into a lipid physically requires more energy than a 5-mer. Peptalyzer™ adds the interfacial values of every residue together, applies any terminal capping penalties, and outputs a single global metric.
The Wimley-White interfacial values in Peptalyzer™ reflect standard physiological ionization (pH 8.0). The tool mathematically applies thermodynamic penalties for uncapped termini, but does not calculate dynamic, pH-dependent pKa shifts upon lipid insertion.
How to Interpret the Total Score on Wimley-White Scale
- Positive Score (>0 kcal/mol) – Aqueous Preference: The peptide resists the lipid bilayer. It is highly water-soluble and energetically unfavorable for membrane insertion.
- Mildly Negative Score (−2 < ΔG° ≤ 0 kcal/mol) – Weak/Transient Binding: The peptide has a slight affinity for the membrane interface. It may associate loosely with the lipid headgroups but is not a strong anchor.
- Highly Negative Score (ΔG° ≤ −2 kcal/mol) – Strong Membrane Insertion: The transfer is highly spontaneous. The peptide will vigorously partition into the lipid bilayer (typical of potent antimicrobial and cell-penetrating peptides).
The Chemist’s Perspective: Avoiding the Wimley-White Scale HPLC Trap
The Chemist’s Trap: Do not use the Wimley-White scale to predict C18 analytical HPLC retention.
The POPC bilayer is a dynamic, amphiphilic liquid-crystal interface. Reversed-phase HPLC (C18) uses a rigid, completely non-polar solid phase. Peptides with high Wimley-White interfacial scores (rich in interface-anchoring aromatics like Tryptophan and Tyrosine) may elute much differently than standard C18 predictive models (like the Hodges scale) suggest.
Additionally, a highly negative ΔG° indicates a strong affinity for lipids, but it does not necessarily predict on-resin aggregation during Solid-Phase Peptide Synthesis (SPPS). SPPS aggregation is primarily driven by localized intermolecular β-sheet formation in organic solvents, which is better evaluated using thermodynamic aggregation risk mapping.
Practical Use Case: Analyzing a Membrane-Active Peptide
When analyzing a sequence in Peptalyzer™, you must read the Wimley-White chart differently than the Kyte-Doolittle chart.
- Kyte-Doolittle (Empirical Index): Positive values (peaks pointing UP) indicate hydrophobicity.
- Wimley-White (Thermodynamics): Negative values (peaks pointing DOWN) indicate spontaneous, energetically favorable lipid insertion.
A Membrane-Resistant Soluble Sequence
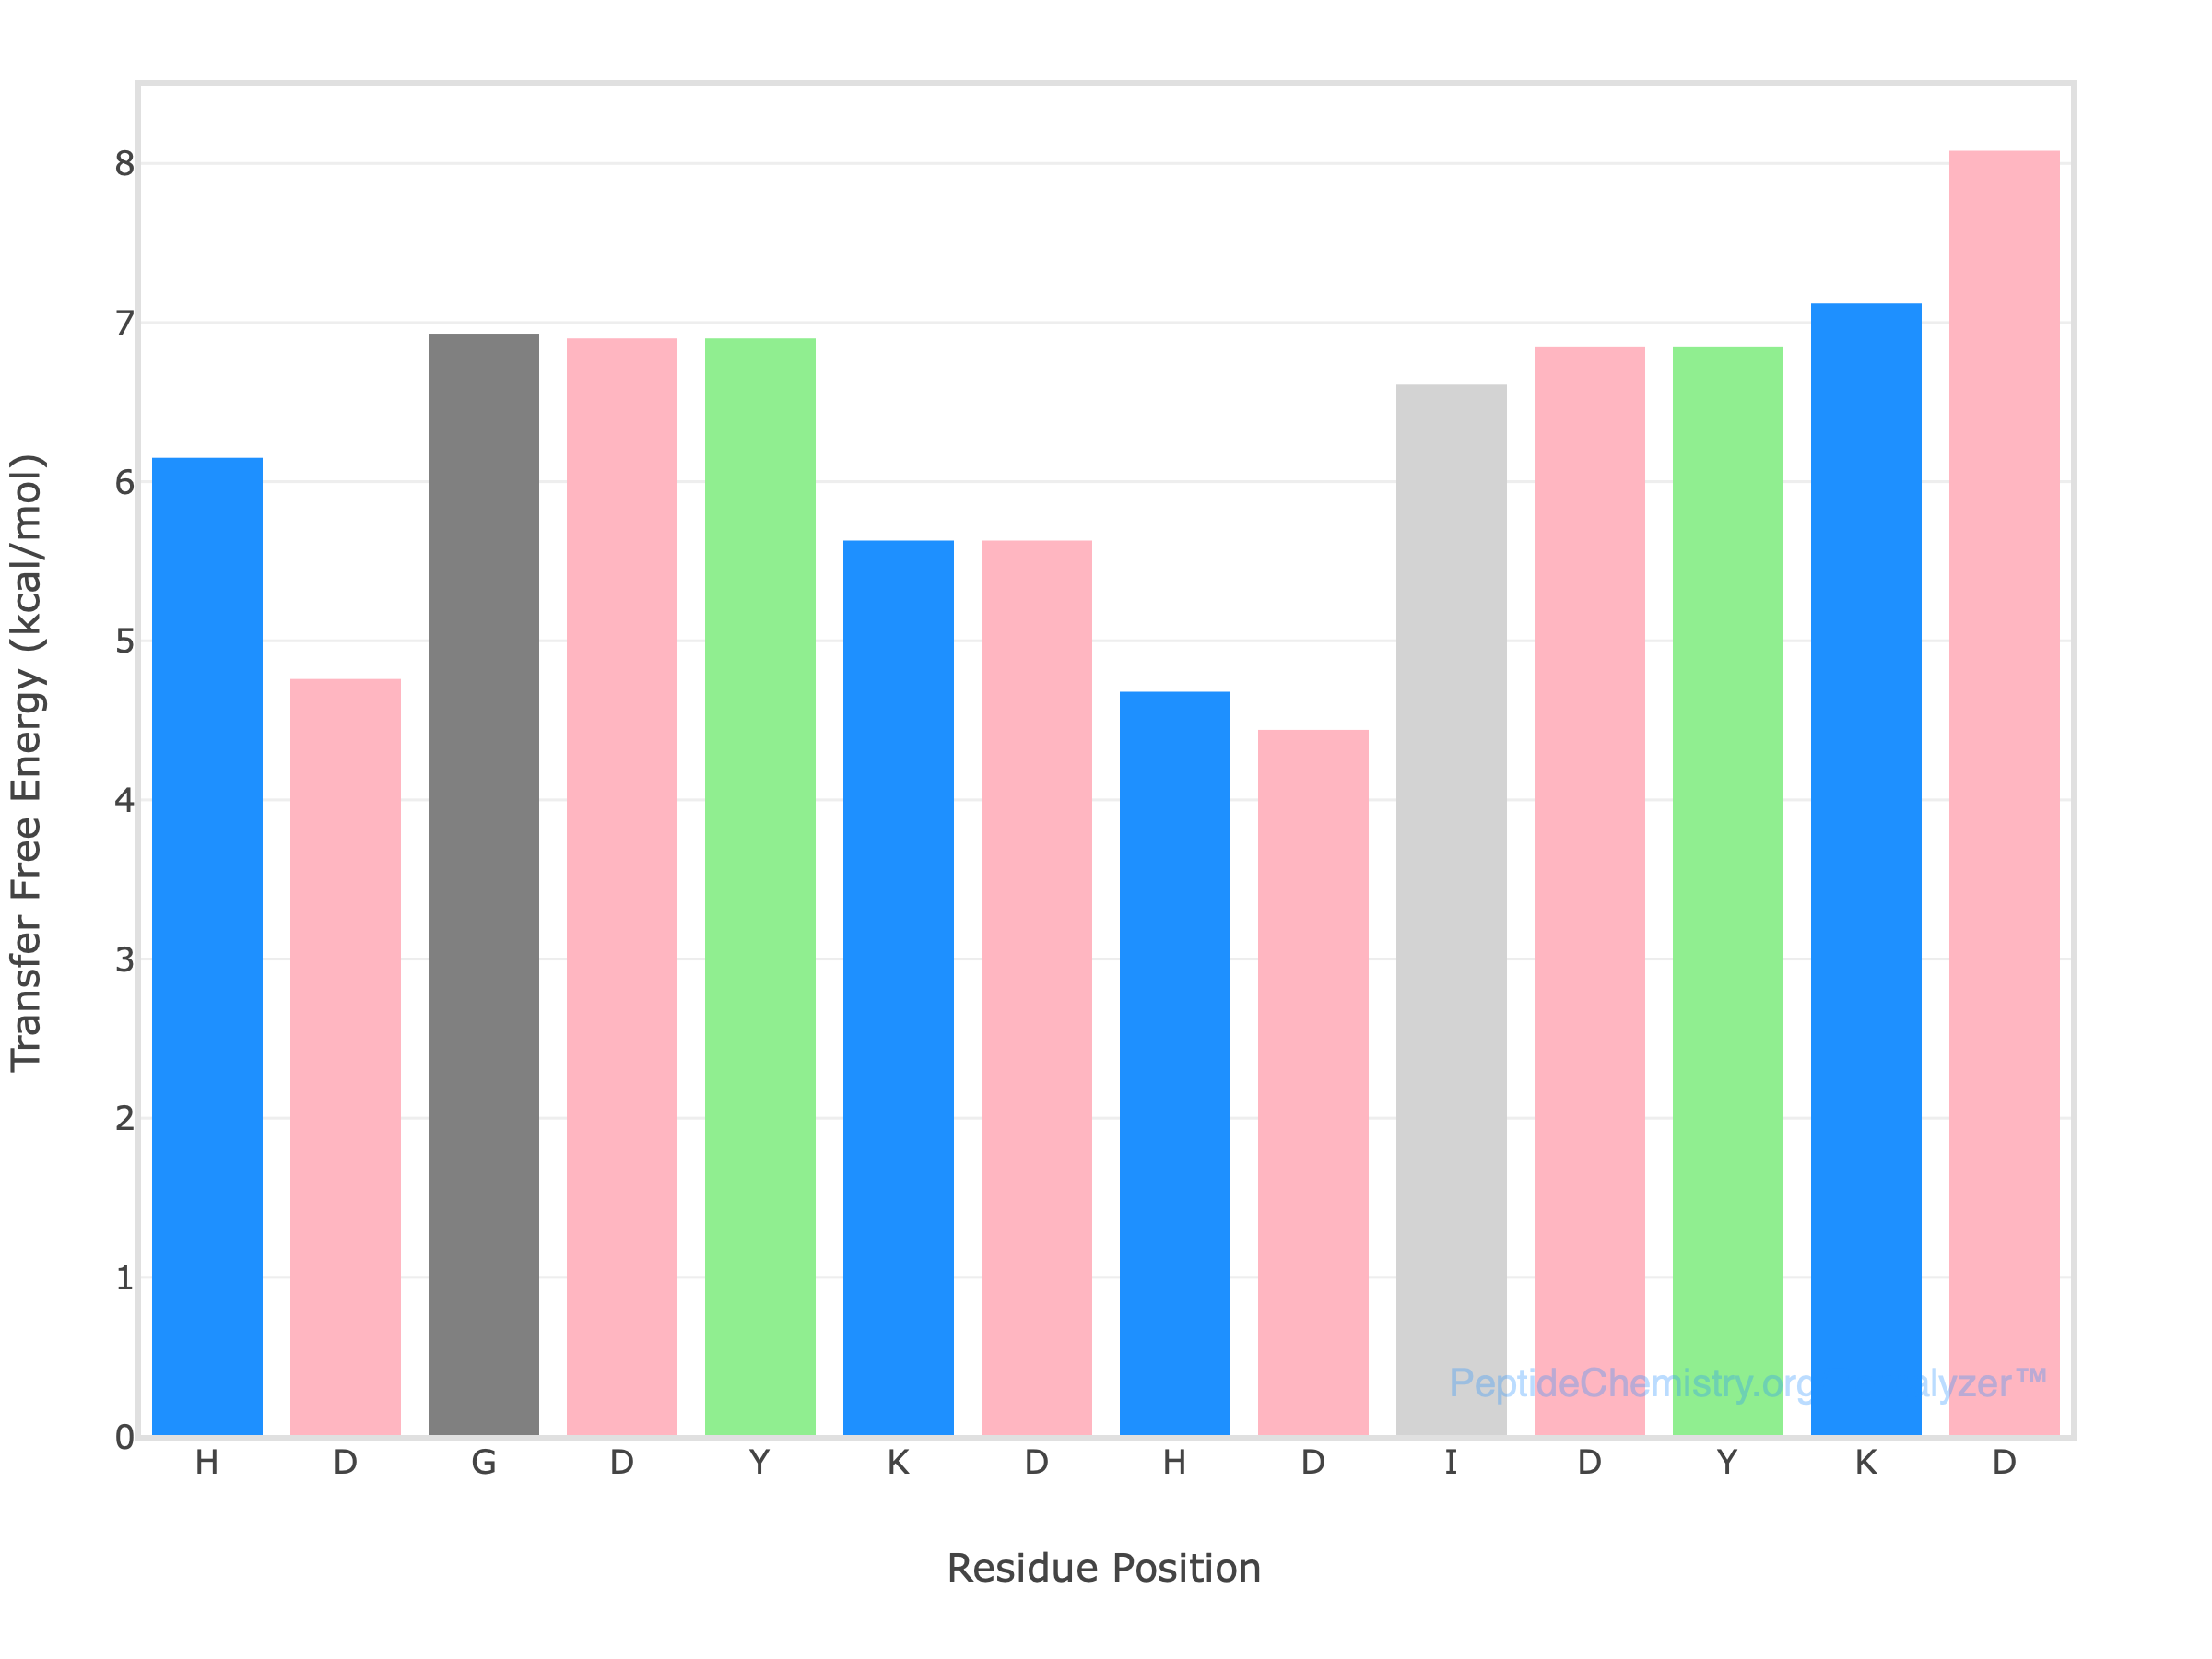
Consider a sequence specifically engineered to be highly charged and entirely water-soluble, such as the widely used 3x FLAG tag: DYKDHDGDYKDHDIDYKDDDDK.
Total Sequence ΔG°: 18.64 kcal/mol (Aqueous Preference)
Interpretation: Notice how the entire 14-bar sliding window profile sits high above the zero-line. Because this 22-mer is packed with charged residues like Aspartate (+1.23 kcal/mol) and Lysine (+0.99 kcal/mol), it carries a massive thermodynamic penalty for entering a lipid bilayer. This tells the chemist immediately that this sequence will remain completely soluble in the aqueous buffer and will strongly resist membrane interaction—exactly what you want for an exposed epitope tag.
A Potent Transmembrane Domain
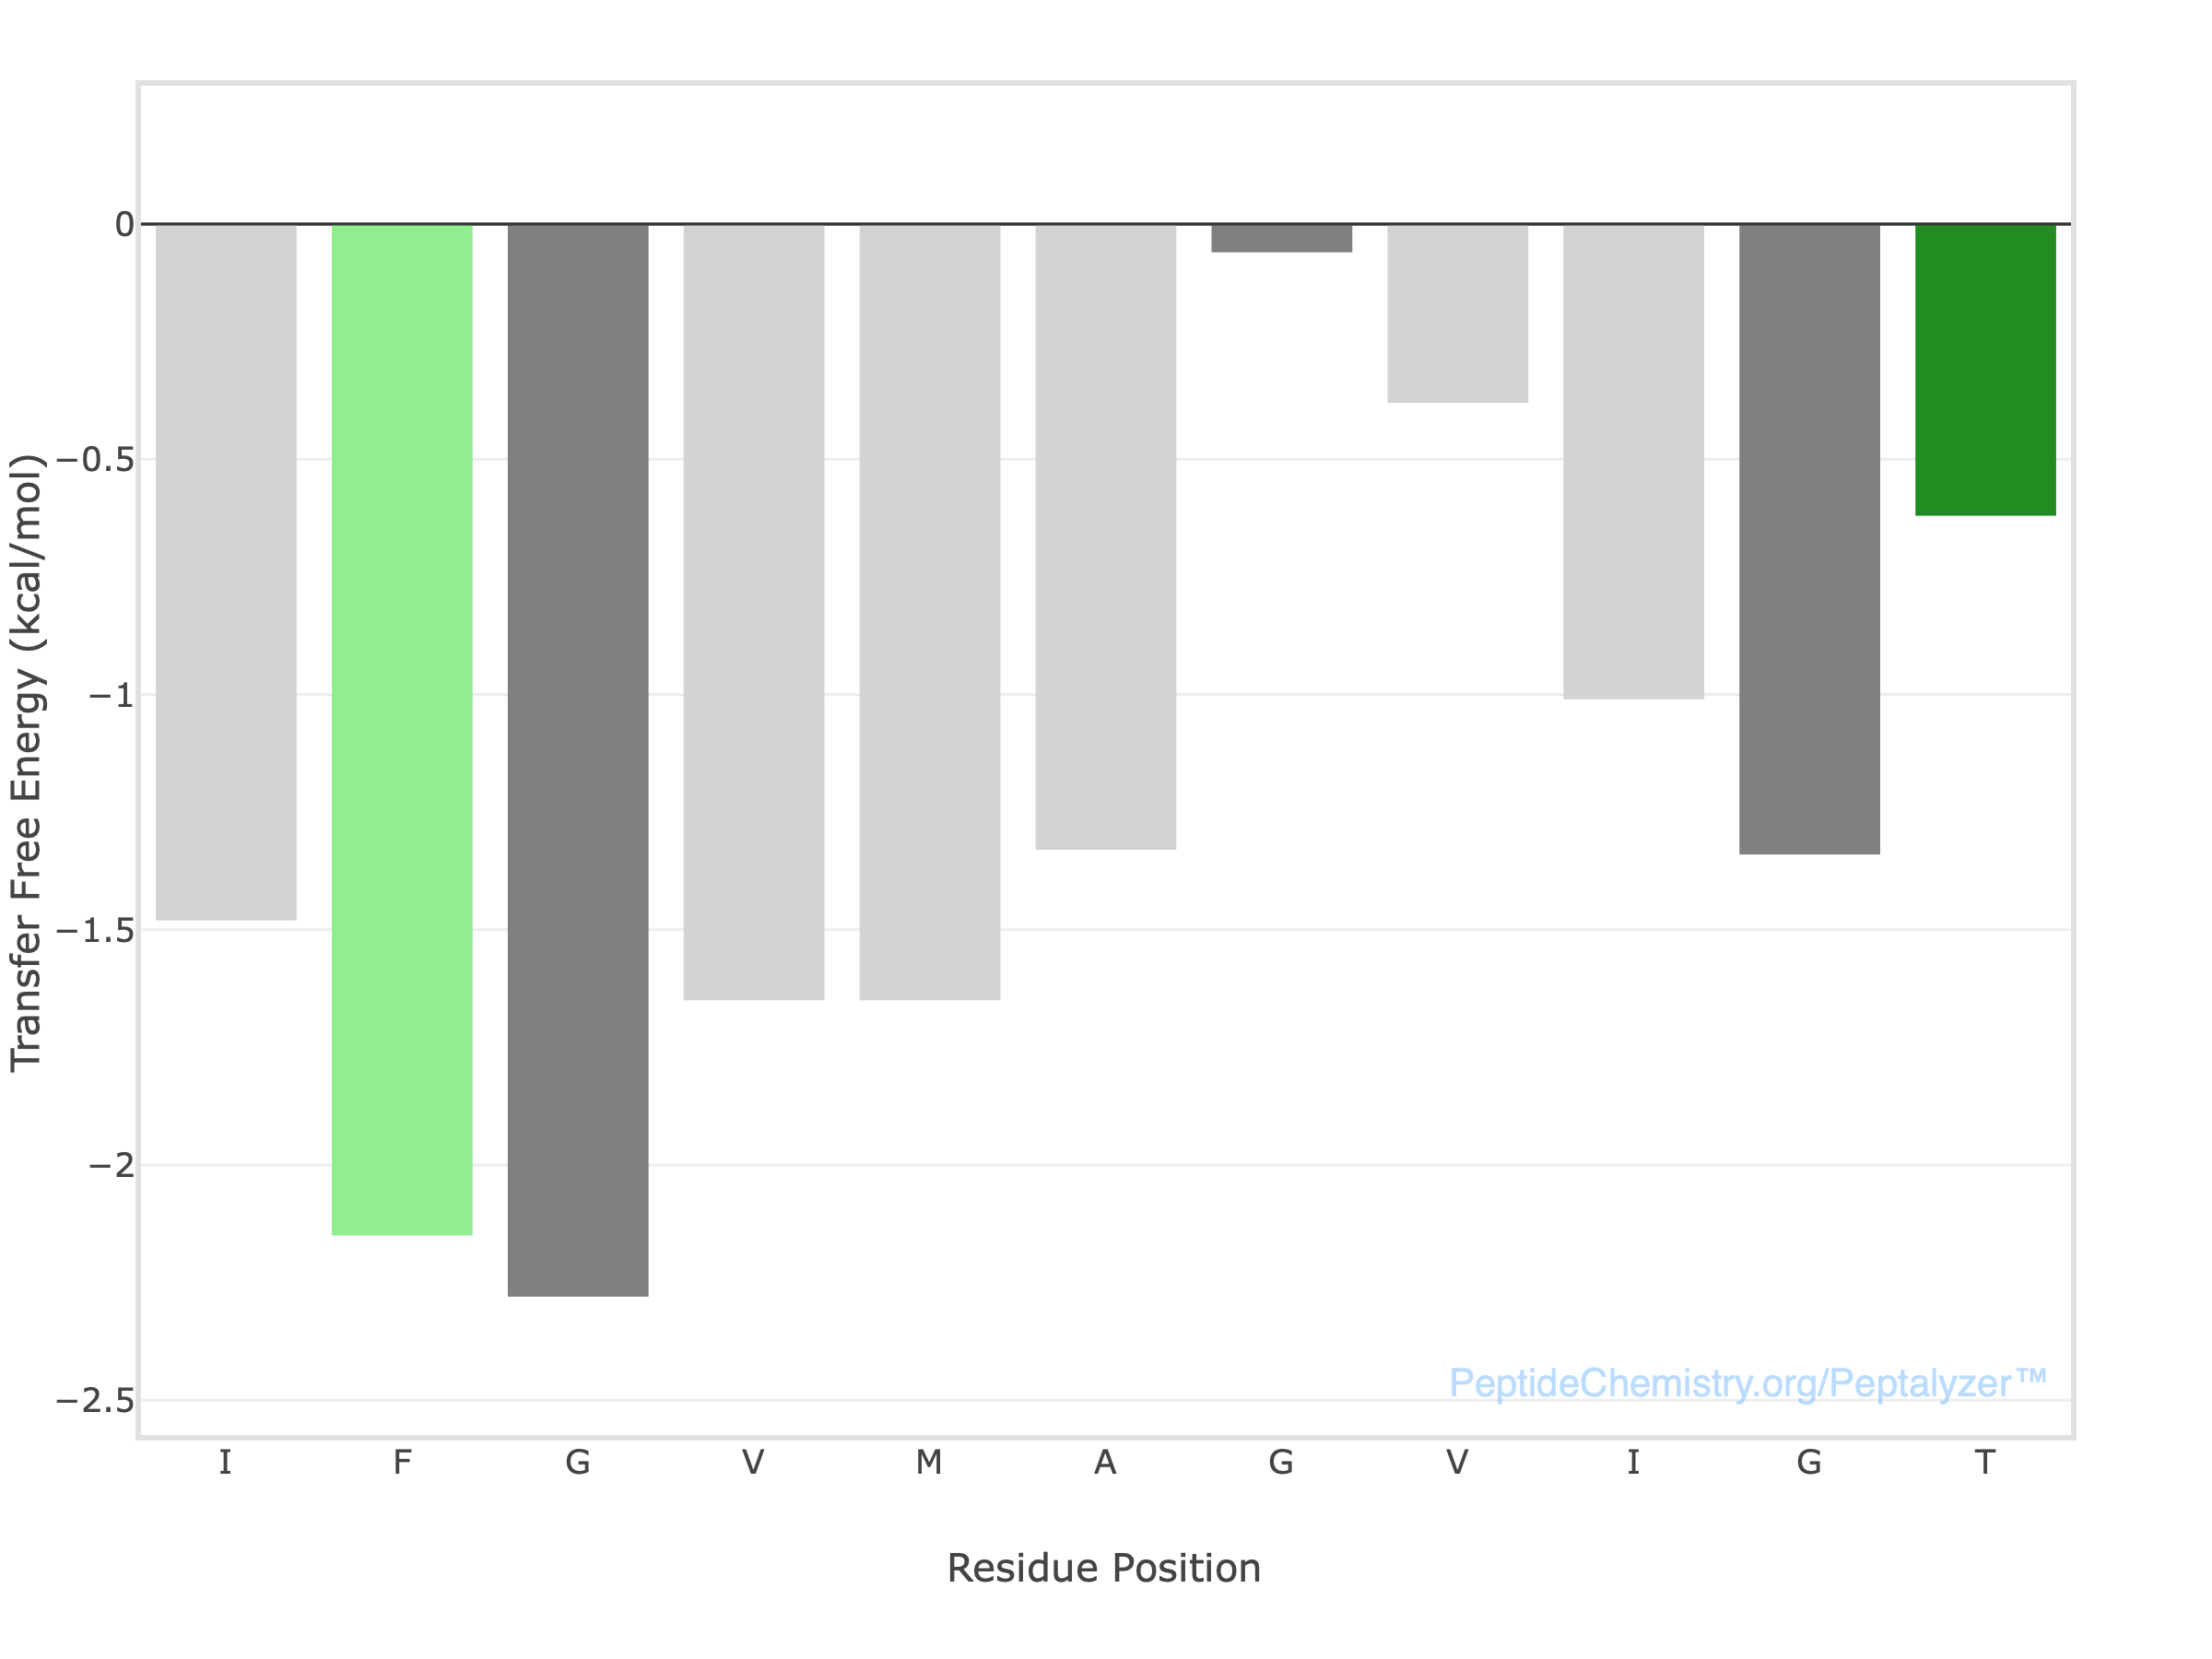
Conversely, let’s look at a sequence designed by nature to plunge into the lipid bilayer, such as the classic transmembrane α-helix domain from human Glycophorin A (ITLIIFGVMAGVIGTILLI). Note that for actual biological insertion, these ends are part of a continuous protein chain, so we will cap the termini (N-Acetyl, C-Amide) in Peptalyzer™ to remove the artificial free-charge penalties.
Total Sequence ΔG°: -4.28 kcal/mol (Strong Membrane Insertion)
Interpretation: Here, the profile plunges deep into negative territory. The Total Sequence ΔG° is highly negative, confirming that the molecule as a whole has a massive thermodynamic driving force to leave the water. The sliding window graph pinpoints exactly which stretch of the sequence serves as the strongest physical lipid anchor.
Comparison: Wimley-White vs. Kyte-Doolittle vs. Hopp-Woods
Knowing which scale to use is just as important as the calculation itself. While Wimley-White calculates strict thermodynamic partitioning energy, and Kyte-Doolittle is used to identify general hydrophobic cores, the Hopp-Woods Hydrophilicity Scale is better suited for mapping surface-exposed antigenic sites where solubility—not membrane depth—is the primary goal.
| Feature | Kyte-Doolittle Hydropathy | Hopp-Woods Hydrophilicity | Wimley-White Partitioning |
|---|---|---|---|
| Primary Aim | Quantify amino acid hydrophobicity and predict hydrophobic regions | Quantify amino acid hydrophilicity and predict surface-exposed regions | Calculate thermodynamic free energy (ΔG°) of membrane partitioning |
| Main Applications | Membrane-spanning helices, folding tendencies, aggregation risks | Epitope mapping, vaccine design, antibody-binding site prediction | Designing AMPs, CPPs, and liposomes; mapping surface anchors vs. full insertion |
| Experimental Correlates | Retention in RP-HPLC, CD spectra of folding | ELISA, antibody recognition assays | Liposome partitioning, vesicle leakage assays, bilayer energetics |
| Limitations | Over-predicts hydrophobic regions; depends heavily on window size | May overestimate antigenicity; ignores secondary/tertiary structure | Does not predict RP-HPLC retention; in vivo activity requires biological context beyond pure thermodynamics |
Noncanonical residues: thermodynamic accuracy is limited when ΔG° values are approximated from canonical analogs, as the scale is strictly derived from experimental measurements.
The Bioinformatics Advantage: Physical Constants vs. Empirical Indices
In the world of bioinformatics, most hydrophobicity scales (like Kyte-Doolittle) are “empirical indices”—meaning they are based on statistical observations or relative solubility in varied solvents. The Wimley-White scale offers a significant “Bioinformatics Advantage” because it treats the peptide as a physical object subject to the laws of thermodynamics.
Whole-Residue Accuracy vs. Side-Chain Estimation
Most bioinformatics tools only look at the amino acid side chains. Wimley-White is a whole-residue scale, meaning it explicitly factors in the +1.15 kcal/mol cost of the polar peptide backbone. By including this “backbone penalty,” the Wimley-White scale provides a more realistic prediction of whether a sequence can physically survive the transition into a lipid environment.
Thermodynamic Sums vs. Statistical Means
Standard tools often calculate a “Mean Hydrophobicity” (like the GRAVY score), which can be misleading for peptides of different lengths. Because thermodynamics is additive, Peptalyzer™ uses a strict sum-based approach.
- The Benefit: A 20-mer and a 5-mer might have the same “average” grease, but the 20-mer requires significantly more total energy to partition. The Wimley-White sum captures this absolute energetic reality.
Context-Aware Terminal Logic
Most online calculators treat a peptide sequence as a string of letters without ends. However, a bench chemist knows that the N- and C-termini are usually charged.
- The Peptalyzer™ Difference: By integrating terminal penalties (+1.15 for N-term, +1.20 for C-term) based on your specific synthesis capping (e.g., Acetylation or Amidation), the tool moves beyond simple bioinformatics and provides an accurate biophysical readout for your actual synthetic product.
Wimley-White Scale – FAQ
Because it measures strict thermodynamics. A negative Gibbs Free Energy (ΔG°) indicates spontaneous, favorable lipid insertion. Thus, downward-pointing valleys pinpoint the membrane-inserting regions.
It depends on the biological mechanism of your peptide. Use the 9-residue window if you suspect your peptide lies horizontally along the membrane surface (like an amphipathic antimicrobial peptide). Use the 19-residue window if you are designing a sequence intended to plunge vertically through the entire lipid bilayer.
It strongly predicts the thermodynamic potential for a peptide to partition into a lipid bilayer. However, actual cell penetration in vivo depends on complex biology, including active cellular transport mechanisms, receptor binding, and lipid raft composition. Use it to optimize lipid affinity, but confirm penetration with biological assays.
Uncapped termini are highly charged, resisting membrane insertion by +1.15 and +1.20 kcal/mol. Capping them (acetylation/amidation) removes this resistance, yielding a much more favorable ΔG°.
Peptalyzer™ anchors the thermodynamic sum to the center of the sliding window (the 5th residue for a 9-mer). To maintain strict thermodynamic accuracy, it does not artificially shrink the window at the edges just to extend the graph.
Not reliably. Membrane affinity doesn’t predict SPPS aggregation, which is driven by β-sheet formation in organic solvents. Use the Kyte-Doolittle scale or specific aggregation profilers instead.
References
Wimley, W. C., & White, S. H. (1996). Experimentally determined hydrophobicity scale for proteins at membrane interfaces. Nature Structural Biology, 3(10), 842-848.
- Defines the Wimley-White interfacial hydropathy scale, often used for membrane proteins.
- DOI: 10.1038/nsb1096-842
Kyte, J., & Doolittle, R. F. (1982). A simple method for displaying the hydropathic character of a protein. Journal of Molecular Biology, 157(1), 105-132.
- Foundational paper introducing the scale.
- DOI: 10.1016/0022-2836(82)90515-0
Hopp, T. P., & Woods, K. R. (1981). Prediction of protein antigenic determinants from amino acid sequences. Proceedings of the National Academy of Sciences, 78(6), 3824–3828.
- Introduced the Hopp–Woods hydrophilicity scale, often contrasted with Kyte–Doolittle.
- DOI: 10.1073/pnas.78.6.3824
Eisenberg, D., Weiss, R. M., & Terwilliger, T. C. (1984). The hydrophobic moment detects periodicity in protein hydrophobicity. Proceedings of the National Academy of Sciences, 81(1), 140-144.
- Describes the Eisenberg scale and hydrophobic moment, an alternative scale.
- DOI: 10.1073/pnas.81.1.140