In peptide chemistry and therapeutic design, one of the key questions is: how likely is a peptide to bind to other proteins? The Boman Index in peptides, introduced by Hans G. Boman in 2003, offers a simple yet powerful metric to estimate a peptide’s protein-binding potential based solely on its amino acid composition. The Boman Index is a key Bio-Predictive Metric used to estimate the potential of a peptide to bind to other proteins. Along with the Instability Index (in vivo half-life) and the Aliphatic Index (thermostability), it helps researchers profile a sequence before synthesis.
Whether you’re developing antimicrobial peptides, targeting ligands, or affinity probes, understanding and calculating the Boman Index can provide insight into your peptide’s bioactivity profile.
Calculate Protein-Binding Potential with Peptalyzer™
Designing a PPI inhibitor or a membrane-active AMP? Use Peptalyzer™ to automatically calculate the Boman Index and confirm your peptide has the correct thermodynamic profile for its target.
📘 What will you learn here?
What Is the Boman Index?
The Boman Index (also referred to as the protein-binding potential or Boman score) estimates how likely a peptide is to interact with proteins. It reflects the average free energy of transfer of amino acid side chains from a nonpolar (hydrophobic) environment into water.
Boman originally introduced by this index to distinguish antimicrobial peptides (AMPs) from hormone-like binders. This metric calculates the total ‘stickiness’ of a peptide based on thermodynamic solubility data. For the synthetic chemist, understanding this index helps predict not just bioactivity, but potentially ‘sticky’ behavior during purification.
While the concept was introduced by Hans Boman (2003), the actual values used in most tools (such as Peptalyzer™) are derived from the experimental solubility scale published by Radzicka & Wolfenden (1988). This makes the Boman Index a hydrophilicity-weighted average, expressed in kcal/mol per residue.
How to Calculate the Boman Index?
Peptalyzer™ computes the Boman Index using the standard solubility values established by Radzicka & Wolfenden (1988), as proposed by Boman. The calculation follows three logical steps.
Summation of Free Energies (ΔG)
The tool iterates through the sequence, summing the transfer free energy (ΔG) for each residue where a valid parameter is defined. For canonical amino acids, direct Radzicka–Wolfenden values are used. Noncanonical residues are included only when a chemically justified canonical analog is defined; otherwise, they may be excluded or block the calculation depending on the evaluation mode. These values represent the energy cost of moving the residue from a hydrophobic environment (cyclohexane) to water.
- Hydrophilic residues (Arg, Lys, Asp) have highly negative values (favorable transfer).
- Hydrophobic residues (Leu, Ile, Phe) have positive values (unfavorable transfer).
Averaging
The total sum is divided by the peptide length (n) to determine the average free energy per residue.
Sign Inversion
The final result is multiplied by -1. This inversion ensures that a higher score reflects stronger protein-binding potential. In this convention, residues with more negative ΔG values increase the Boman Index after sign inversion, while more positive ΔG values lower it.
\[\text{Boman Index} = -\frac{\sum_{i=1}^{n} \Delta G_i}{n}\]Where:
- ΔG is the solubility free energy of amino acid i (in kcal/mol)
- n is the total number of residues in the peptide
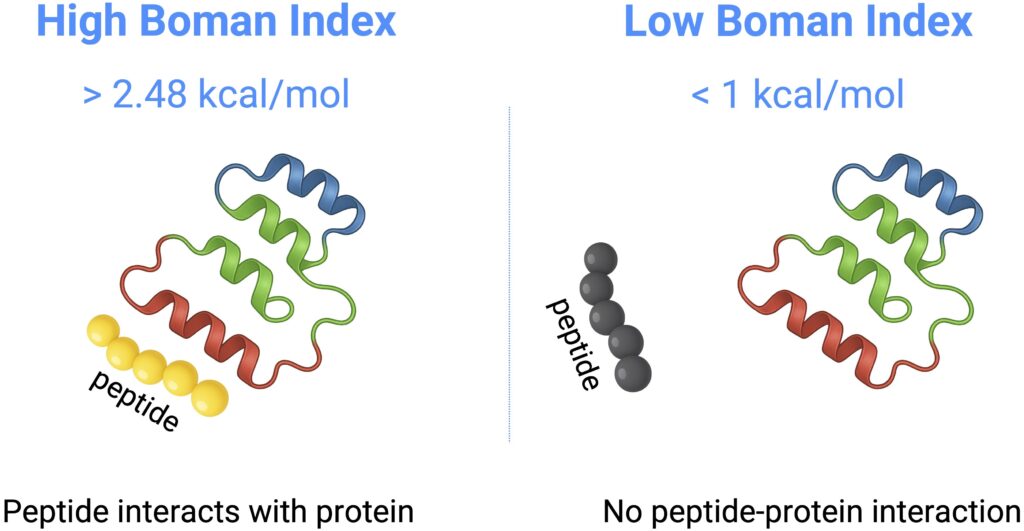
A higher Boman Index (e.g., ≥ 2.48 kcal/mol) suggests stronger protein-binding potential, while lower values often correlate with increased membrane selectivity, useful in antimicrobial peptide design.
The full list of amino acid ΔG values used in this calculation is provided in the table.
| Amino Acid | ΔG (kcal/mol) |
|---|---|
| Arginine (R) | −14.92 |
| Aspartic Acid (D) | −8.72 |
| Glutamic Acid (E) | −6.81 |
| Asparagine (N) | −6.64 |
| Lysine (K) | −5.55 |
| Glutamine (Q) | −5.54 |
| Histidine (H) | −4.66 |
| Serine (S) | −3.40 |
| Threonine (T) | −2.57 |
| Tyrosine (Y) | −0.14 |
| Proline (P) | 0.00 |
| Glycine (G) | 0.94 |
| Cysteine (C) | 1.28 |
| Alanine (A) | 1.81 |
| Tryptophan (W) | 2.33 |
| Methionine (M) | 2.35 |
| Phenylalanine (F) | 2.98 |
| Valine (V) | 4.04 |
| Isoleucine (I) | 4.92 |
| Leucine (L) | 4.92 |
Handling of Noncanonical Amino Acids
The Boman Index is fundamentally defined using experimentally derived free-energy values for the 20 canonical amino acids. No direct experimental constants exist for noncanonical residues. Peptalyzer™ therefore includes noncanonical amino acids only through explicit canonical analog mapping defined in its residue library.
Residues such as Norleucine (Nle) and Norvaline (Nva) are treated as supported analogs of Leucine and Valine, respectively. Other residues—including AmPhe, Cit, Hyp, and Orn—are handled as partial-support cases using chemically reasonable canonical mappings (Phe, Gln, Pro, and Lys). These approximations are exposed transparently in the interface.
Residues without a defensible analog, such as Aib and beta-Ala, are considered unsupported for this model. In strict mode, their presence disables the Boman Index calculation. In exploratory mode, partial-support residues may be included using their mapped analog values, while unsupported residues still block the calculation.
As a result, the Boman Index remains a canonical thermodynamic model. When noncanonical residues are present, the output should be interpreted as an approximation whose reliability depends on the quality of the underlying analog mapping. Full details are provided in the noncanonical amino acids guide.
The Boman Index Protein-Binding Potential Interpretation
High Boman Index (≥ 2.48 kcal/mol):
Stronger protein-binding potential (e.g. hormones, signaling peptides)
Moderate (1.0–2.47 kcal/mol):
Possible mixed mechanism
Low (< 1.0 kcal/mol):
Lower affinity for proteins, often membrane-active (e.g. AMPs)
The 2.48 kcal/mol threshold comes directly from Boman’s 2003 paper, where he proposed the index to distinguish protein-binding peptides (like hormones) from antimicrobial peptides. Using ΔG values from Radzicka & Wolfenden (1988), Boman suggested that peptides with values above 2.48 are more likely to bind proteins, while lower values indicate membrane selectivity — a trait typical of AMPs.
Why is it kcal/mol per residue? Units are reported per residue, as the index is averaged over sequence length.
The Chemist’s Perspective: “Sticky” Peptides
While biologists use the Boman Index to predict receptor binding, chemists should interpret a high Boman Index (>2.48 kcal/mol) as a warning for “Stickiness.”
- Purification Risks: High-Boman peptides often exhibit broad peaks or “ghosting” on HPLC columns because they interact non-specifically with the silica matrix or capped silanols.
- Solubility: Unlike the Aliphatic Index (where high = insoluble/aggregate), a high Boman index often implies good aqueous solubility but high adsorption potential. These peptides may stick to plasticware (Eppendorf tubes) at low concentrations.
- Advice: If your Boman Index is high, consider adding a small amount of non-ionic detergent (e.g., Tween-20) or BSA to your assay buffer to prevent loss of peptide to container walls.
Practical Use Cases for using the Boman Index
Antimicrobial Peptides (AMPs)
Antimicrobial peptides (AMPs) often benefit from a low Boman Index. This helps reduce unwanted binding to host proteins and increases selectivity for microbial membranes.
Why does this matter?
The Boman Index estimates a peptide’s protein-binding potential, not its interaction with membranes. Most AMPs do not function by binding to proteins like hormones or enzymes. Instead, they work by disrupting microbial membranes, making a low Boman Index more desirable for their intended mechanism of action
Peptide Therapeutics
Therapeutic peptides with a high Boman Index are more likely to bind to target proteins, making them suitable for applications that rely on specific protein interactions.
These include:
- Receptor binding (e.g., peptide hormones like insulin or glucagon)
- Inhibition or modulation of protein–protein interactions (PPI) (e.g., peptides designed to block signaling pathways or disrupt disease-related complexes)
In these cases, strong protein-binding potential is not only acceptable—it is essential. A high Boman Index suggests that the peptide’s side chains favor aqueous environments, which supports surface exposure and interaction with biological targets.
Therefore, while a low Boman Index benefits antimicrobial peptides, a high Boman Index is a positive indicator for receptor-targeting or intracellular-acting therapeutic peptides.
Protein-Protein Interaction Inhibitors
Peptides designed to inhibit protein–protein interactions (PPIs) typically require a moderately high Boman Index. This reflects their need for strong and selective protein-binding potential, enabling them to effectively interfere with large, flat, and dynamic interaction surfaces.
Why a moderately high Boman Index?
Unlike enzyme active sites or receptor pockets, PPI interfaces lack deep binding grooves. Instead, they often involve extended and shallow surfaces. To compete with native protein partners, a PPI inhibitor must:
- Bind tightly to exposed residues on the target surface,
- Remain soluble and stable in aqueous environments,
- Present side chains that favor protein contact over membrane insertion.
A moderately high Boman Index suggests the peptide has an optimal mix of hydrophobic and polar residues needed for surface recognition and stable binding—without excessive aggregation or nonspecific interactions.
Design Consideration
Peptides with Boman Index values in the mid-to-high range (e.g., 1.5–3.0 kcal/mol) are often good candidates for PPI inhibition, especially when paired with structural elements like β-strands or helices to mimic natural interface motifs.
Example Calculation
Let’s say we have a 6-mer peptide: KWYFHC
Using the ΔG values:
- K (-5.55)
- W (2.33)
- Y (-0.14)
- F (2.98)
- H (-4.66)
- C (1.28)
Total ΔG = −5.55 + 2.33 − 0.14 + 2.98 − 4.66 + 1.28 = −3.76 kcal/mol
Boman Index = −(−3.76 / 6) = 0.63 kcal/mol
This peptide has low protein-binding potential.
Limitations and Considerations when using the Boman Index
- Thermodynamics vs. Structure — The Boman Index is a thermodynamic estimate, not a structural simulation.
- No Structural Context — A peptide with the sequence
RRRR-LLLLhas the exact same Boman Index asRLRL-RLRL, yet their behavior will be completely different. The index cannot predict the formation of amphipathic helices which are critical for actual binding. - No structural insight — it does not account for 3D conformation, charge distribution, or folding, which can heavily influence binding behavior.
- Membrane interactions are not modeled — the Boman Index is derived from solubility-based free energy values, not lipid bilayer partitioning. For membrane activity prediction, other descriptors (like hydropathy or amphipathicity) are more relevant.
- One descriptor among many — it should be used alongside additional properties (e.g., charge, hydropathy, length, aggregation potential) to evaluate peptide bioactivity more accurately
- False Positives: A high index indicates potential to bind proteins, but it does not guarantee specificity. A “sticky” peptide might bind albumin non-specifically rather than your target receptor.
- An additional limitation arises when noncanonical residues are present. Since the model relies entirely on canonical free-energy constants, any inclusion of modified residues depends on analog mapping and may introduce uncertainty. In such cases, the Boman Index should be interpreted alongside other physicochemical descriptors rather than used in isolation.
How to Use the Boman Index in Your Workflow?
You can easily integrate Boman Index calculation into your peptide analysis pipeline. In fact, tools like Peptalyzer™ already compute it alongside other descriptors like:
- Isoelectric point (pI)
- Net charge
- Hydropathy index
- Molecular mass
- Instability Index
- Aliphatic Index
- GRAVY score
- …and other
Tip: Aim for a balanced Boman Index tailored to your peptide’s purpose. High isn’t always better!
Boman Index – FAQs
The Boman Index estimates a peptide’s ability to bind proteins, based on the average free energy of solubility (ΔG) of its amino acid sequence.
Add the ΔG values for all amino acids in the peptide, divide by the number of residues, and multiply the result by –1 to get the Boman Index in kcal/mol per residue.
A value of ≥ 2.48 kcal/mol suggests strong protein-binding potential, useful for receptor ligands or PPI inhibitors.
Typically, antimicrobial peptides have low Boman Index values (<1) to ensure membrane targeting and avoid host protein binding.
No — it should be combined with descriptors like hydropathy, charge, and isoelectric point for a complete bioactivity profile.
References
Boman, H. G. (2003). Antibacterial peptides: basic facts and emerging concepts. Journal of Internal Medicine, 254(3), 197–215.
- Introduced the Boman Index as a predictor of protein-binding potential.
- DOI: 10.1046/j.1365-2796.2003.01228.x
Radzicka, A., & Wolfenden, R. (1988). Comparing the polarities of the amino acids: side-chain distribution coefficients between the vapor phase, cyclohexane, 1-octanol, and neutral water. Biochemistry, 27(5), 1664–1670.
- Provided the thermodynamic solubility scale used in Boman Index calculations.
- DOI: 10.1021/bi00405a042
Peptides R Package: boman() function.
- Confirms Boman Index calculation method, amino acid ΔG values, and ≥ 2.48 threshold for high protein-binding classification.
- Link: boman: Compute the Boman (Potential Protein Interaction) index