The Aromaticity Index: Why It Matters for Peptide Solubility and Synthesis
The Aromaticity Index is more than just a bioinformatic statistic; for the synthetic chemist, it is a critical predictor of ordered aggregation that standard hydrophobicity scales often miss. When designing or synthesizing a peptide, the presence of aromatic residues—primarily Phenylalanine (Phe, F), Tryptophan (Trp, W), and Tyrosine (Tyr, Y), as well as any noncanonical residues with defined aromatic character—fundamentally alters the molecule’s behavior.
While often discussed in the context of protein folding or UV quantification, the Aromaticity Index serves as an early warning system for Solid-Phase Peptide Synthesis (SPPS). High aromaticity often correlates with “difficult sequences,” where intermolecular interactions lead to gelation and incomplete coupling.
This article explores the mechanism behind aromatic interactions, why standard metrics like GRAVY fail to predict them, and how to accurately calculate the index (including the critical Histidine exception).
Predict π−π Stacking with Peptalyzer™
Use Peptalyzer™ to calculate your exact Aromaticity Index and identify hidden π−π stacking risks before they cause gelation on your resin.
📘 What will you learn here?
The Chemistry of Aromaticity in Peptides
Aromaticity in peptides refers to the collective influence of the aromatic side chains: the benzyl group of Phenylalanine, the phenol of Tyrosine, and the indole of Tryptophan. Unlike simple hydrophobic residues (like Leucine or Valine), aromatic residues engage in π-π stacking interactions.
The Mechanism of π-π Stacking
In aqueous environments and polar organic solvents, the planar aromatic rings of adjacent peptide chains can stack parallel to one another. This interaction is driven by quadrupole-quadrupole forces and dispersion forces.
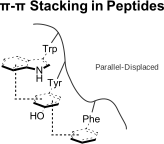
- Stability: In native proteins, these interactions stabilize the tertiary structure.
- Aggregation: In synthetic peptides, these stacks form extended intermolecular networks. This phenomenon is a primary driver of amyloid-like fibril formation, which can precipitate the growing peptide chain within the resin matrix.
The “Kyte-Doolittle Trap” (Why GRAVY Fails)
It is standard practice to check the GRAVY (Grand Average of Hydropathy) score before synthesis. GRAVY is calculated using the Kyte-Doolittle scale. While excellent for predicting transmembrane domains, it often fails for aromatic peptides.
The Kyte-Doolittle scale assigns values based on water-vapor transfer free energy. Because Tryptophan and Tyrosine have polar groups (indole nitrogen and phenol hydroxyl), they are classified as hydrophilic:
- Isoleucine: +4.5 (Hydrophobic)
- Phenylalanine: +2.8 (Hydrophobic)
- Tryptophan: -0.9 (Hydrophilic)
- Tyrosine: -1.3 (Hydrophilic)
As a consequence, a peptide rich in Tryptophan will have a low or negative GRAVY score, suggesting good solubility. In reality, the strong π-π stacking forces will likely cause it to aggregate into insoluble fibrils. Therefore, you should check the Aromaticity Index separately from GRAVY.
Aromaticity Index vs. Aliphatic Index
It is impossible to fully evaluate peptide solubility without considering both aromaticity and the Aliphatic Index. While they both predict “hydrophobicity,” they function differently and require different handling strategies.
| Feature | Aliphatic Index | Aromaticity Index |
|---|---|---|
| Key Residues | Ala, Val, Ile, Leu | Phe, Trp, Tyr (His*) |
| Aggregation Force | Hydrophobic Collapse (Volume) | π-π Stacking (Electronic) |
| Structure | Disordered precipitates | Ordered Amyloid-like Fibrils |
| Solubility Risk | High (Requires organic solvents) | Very High (Requires chaotropes) |
How Peptalyzer Calculates Aromaticity Index
To ensure transparency, Peptalyzer™ uses the Lobry–Gautier aromaticity concept, implemented as a residue-metadata calculation plus a separately reported histidine-inclusive variant for neutral-pH interpretation (no dynamic pH speciation model).
Classical reference formula (canonical residues):
This definition is traditionally limited to the canonical aromatic residues (F, W, Y). In Peptalyzer™, aromaticity is determined directly from residue-level structural metadata rather than fixed canonical lists. This allows noncanonical residues to be included when they are explicitly defined as aromatic in the residue library. As a result, aromaticity calculation extends naturally to modified residues without requiring analog mapping or approximation. Full details of residue classification and handling rules are provided in the noncanonical amino acids guide. Terminal modifications are not counted in aromaticity; the metric is residue-only.
Histidine at Neutral pH
Standard bioinformatics tools exclude Histidine because, at acidic pH (like in HPLC mobile phases), the imidazole ring is protonated (His+) and repels stacking. However, at neutral pH (physiological conditions), Histidine is neutral and stacks efficiently.
Peptalyzer™ Implementation:
- Standard View: Returns the classic index (excluding His) for synthesis/purification planning.
- Detailed View: If Histidine is present, the tool reports a second histidine-inclusive aromaticity value.
This ensures you do not underestimate aggregation risks when moving from the HPLC vial (acidic) to the biological assay (neutral). In Peptalyzer™, this is implemented as a reporting variant rather than a dynamic speciation model.
Practical Strategies for High-Aromaticity Peptides
If your calculated aromaticity index is high (typically >0.15), adopt these synthesis modifications to ensure purity.
Disrupt the Stacks
High aromaticity leads to β-sheet stacking. Standard solvents like DMF are often insufficient to break these electronic interactions.
- Recommendation: Test NMP (N-methyl-2-pyrrolidone) as the primary solvent.
- Additives: Test adding chaotropic salts like LiCl or KSCN (0.1 M) to the coupling mixture to disrupt the hydrogen bonding network that supports the stacks.
Use Backbone Protection
Inserting a Pseudoproline (oxazolidine derivative) or an Isoacyl Dipeptide (Hmb) prevents the formation of the secondary structures that align the aromatic rings for stacking.
HPLC Optimization
Aromatic peptides are notoriously “sticky” on C18 columns.
- Column: Try switching to a C4 or C8 column to reduce hydrophobic retention.
- Temperature: Test the column temperatures at 40–60 °C. The thermal energy disrupts π-π interactions, significantly sharpening peak shapes and improving recovery.
Fmoc Deprotection Risks
High aromatic content can entrap the terminal Fmoc group, slowing Fmoc deprotection. However, be cautious when using stronger bases (like DBU) to force deprotection. DBU increases the risk of aspartimide formation if Asp residues are present. Always monitor the deprotection peak width carefully.
Beyond Composition: The “Position Effect”
A major limitation of standard metrics (like GRAVY or the basic Aromaticity Index) is that they are blind to sequence order. They treat the sequence as a “bag of amino acids.”
The Clustering Problem
Consider two peptides with identical composition (50% Alanine, 50% Tryptophan):
- Sequence A:
WWWW-AAAA(Clustered) - Sequence B:
WA-WA-WA-WA(Dispersed)
Standard calculators give both the same Aromaticity Score (0.5). The sequence A is critically difficult. The contiguous Tryptophans form a “hydrophobic zipper” or strong π-π stacking block that nucleates aggregation immediately. On the other hand, the sequence B is less likely to be insoluble because the bulky aromatics are interrupted by spacers, breaking the stacking network.
The “Terminal Effect”
Position matters. Aromatic residues at the C-terminus (the start of SPPS) are more dangerous than those at the N-terminus.
- C-Terminal Anchors: If the first few residues coupled to the resin are aromatic (e.g., Fmoc-Phe-Trp-Resin), they can form aggregates on the solid support that ruin the diffusion for all subsequent couplings.
- N-Terminal Caps: Aromatics added at the very end of synthesis might cause solubility issues during purification, but they won’t ruin the synthesis of the underlying chain.
The Aromaticity Index – FAQ
A score above 0.15 (15%) is generally considered high for a synthetic peptide. For comparison, typical globular proteins average around 0.08–0.10. Peptides above this threshold often require synthesis optimization (pseudoprolines or chaotropic salts).
GRAVY uses the Kyte-Doolittle scale, which classifies Tryptophan (-0.9) and Tyrosine (-1.3) as hydrophilic because it measures water-vapor transfer, not stacking potential. Relying on GRAVY alone for aromatic peptides is a common error that leads to unexpected aggregation.
Include Histidine if you are working at neutral or basic pH (e.g., pH > 6.5). Under these conditions, the imidazole ring is uncharged and participates in π-stacking. At acidic pH (HPLC), Histidine is positively charged and disrupts stacking, so the standard index is more accurate.
No, the standard index is a composition metric (percentage). It does not distinguish between clustered aromatics (high risk) and dispersed ones (lower risk). For critical analysis, you must visually inspect the sequence for “aromatic blocks” (e.g., WW, YY, FF) or C-terminal aromatic clusters, which are prone to early-stage aggregation on the resin.
No. The Aromaticity Index specifically predicts aggregation driven by electronic π-stacking. It does not account for “hydrophobic collapse” caused by bulky aliphatic residues (measured by the Aliphatic Index) or the specific sequence order (clustering). A peptide can have a low Aromaticity Index but still be insoluble if it has a high Aliphatic Index. You must evaluate Aromaticity, Aliphatic Index, and GRAVY together for a complete picture.
References
Bjellqvist, B., Basse, B., Olsen, E., & Celis, J. E. (1994). Reference points for comparisons of two-dimensional maps of proteins from different human cell types defined in a database of isoelectric points and molecular weights. Electrophoresis, 15(1), 529–539.
- Established the foundational pK values used in almost all modern isoelectric point (pI) calculators.
- DOI: 10.1002/elps.1150150171
Gazit, E. (2002). A possible role for π-stacking in the self-assembly of amyloid fibrils. FASEB Journal, 16(1), 77–83.
- Seminal paper proposing that aromatic π-stacking, rather than just hydrophobic collapse, drives the specific self-assembly of amyloid fibrils.
- DOI: 10.1096/fj.01-0442hyp
Kyte, J., & Doolittle, R. F. (1982). A simple method for displaying the hydropathic character of a protein. Journal of Molecular Biology, 157(1), 105–132.
- The origin of the hydropathy scale used for GRAVY scores; notably classifies Trp and Tyr as hydrophilic based on water-vapor transfer energy.
- DOI: 10.1016/0022-2836(82)90515-0
Lobry, J. R., & Gautier, C. (1994). Hydrophobicity, expressivity and aromaticity are the major trends of amino-acid usage in 999 Escherichia coli chromosome-encoded genes. Nucleic Acids Research, 22(15), 3174–3180.
- Identified aromaticity as a major, distinct statistical trend in protein composition, independent of general hydrophobicity.
- DOI: 10.1093/nar/22.15.3174
Vernon, R. M., Chong, J. P., Tsang, B., Kim, T. H., Bah, A., Forman-Kay, J. D., & Chan, H. S. (2018). Pi-Pi contacts are an overlooked protein feature relevant to phase separation. eLife, 7, e31486.
- Modern analysis demonstrating how cation-π and π-π interactions drive phase separation and aggregation in intrinsically disordered regions.
- DOI: 10.7554/eLife.31486